China container shipping report June 2023


The following update is based on primary and secondary research on the shipping container market. We also borrow findings from the monthly container logistics report and the monthly forecaster published by Container xChange, an online container logistics platform that provides an infrastructure to trade, lease and manage shipping containers.
The aim is to condense the monthly learnings to share location-wise learnings with those interested in what’s happening in specific locations, for this update, in China.
Key highlights–
- Mixed Clouds for China’s trade comeback
- China – Russia trade on the rise
- Intra-Asia trade continues to show resilience
- Average container prices stabilise in China
- CAx (Container Availability Index) Update
- China Rebound?
China’s exports to the EU and the US declined after central banks and the Federal Reserve raised interest rates in March. The demand for products from China in these markets was already low. Despite that, however, China’s exports did see a rebound in Q1 2023. Exports in March rose 14.8% from a year ago after months of declines. The General Administration of Customs of China reported that exports went up 0.5% over the same period in 2022 to $821.8 billion in the first three months of the year.
This could be attributed to the fact that factories are now running at full capacity and working on fulfilling accumulated orders. China’s COVID-19 outbreak had depleted the inventories until the beginning of 2023. But now, the country’s international trade is displaying resilience.
The Shanghai Containerized Freight Index rose for three consecutive weeks in April. That had not happened since June 2022.
This was influenced by the increase in shipping rates to the US East Coast from Asia by around $137 per 40ft container in April when compared with the previous weeks. On the other hand, spot rates on the US routes fell by around 80% of their peak levels last year. In the face of the current geopolitical friction between China and the US, it remains to be seen if the stability in China will be challenged anytime soon.
- China – Russia trade on the rise
China is the world’s biggest energy consumer and demand for domestic fuel rebounded once the Covid restrictions were lifted. Chinese refiners took advantage of the cheap prices of fuel imported from Russia. Not just refiners, the country has increased other purchases from Russia after the US and EU cut their Russian imports. No wonder then that imports from Russia, primarily oil and gas, reportedly rose by 40.5% in a year. China’s trade deficit with Russia has lessened by 50% to $2 billion and exports to Russia have more than doubled to $9 billion over a year.
On the Container xChange platform, China to Russia has been the most popular route this year and the average pickup (PU) charge for leasing a container in the route was $905. For example, the average PU rate from Ningbo to Moscow was $985 and the same from Shanghai was $830. After Russia, the popular destinations from China included North America and North Europe.
- Intra-Asia trade continues to show resilience
Not just with Russia, intra-Asia trade has significantly outperformed Asia-Europe and Asia-US trade as well. Especially after a decline in consumer confidence in the EU and North American consumer markets, overstocked retail inventories, and the collapse of ocean freight rates last year. The intra-Asian economy, in comparison, has proven to be far more resilient. According to the United Nations Conference on Trade and Development (UNTCAD), East Asia was the only region with a positive quarter-to-quarter trade growth rate in Q3 2022.
Within that context, a rebound in demand from China will benefit both the global suppliers and the country’s Asian neighbours. The China-Southeast Asia trade is emerging as a strong economic partnership this year. China’s largest trade partner is the Association of Southeast Asian Nations (ASEAN) and shipments to these nations have grown by 35.43% year-over-year. This dramatic increase underlines China aiming to strengthen trade ties in these markets.
Despite the global supply chain wanting to reduce dependency on China, the country’s major sea ports are opening new container shipping routes this year to expand capacity, enhance foreign trade and increase market share. For example, in Q1 2023, the Shandong Province launched 13 new shipping routes in forging boutique lines bound for European and American countries.
On Container xChange platform, ports in China were the most popular trading locations in the month of May. Vietnam, Indonesia and Singapore followed suit.
- Average container prices stabilise in China
The average prices for 20 ft brand new containers have been declining across various ports in China. A long-term view of these prices gives us a good knowledge of how the demand for containers declined in China since September 2021. Below is a chart that studies the average prices for 20 feet of dry cargo brand-new containers across key ports in China. We see that these average prices were somewhere around $4047 in Shanghai in October 2021. From there, we see a dip of 43% to $2333 in May 2023.
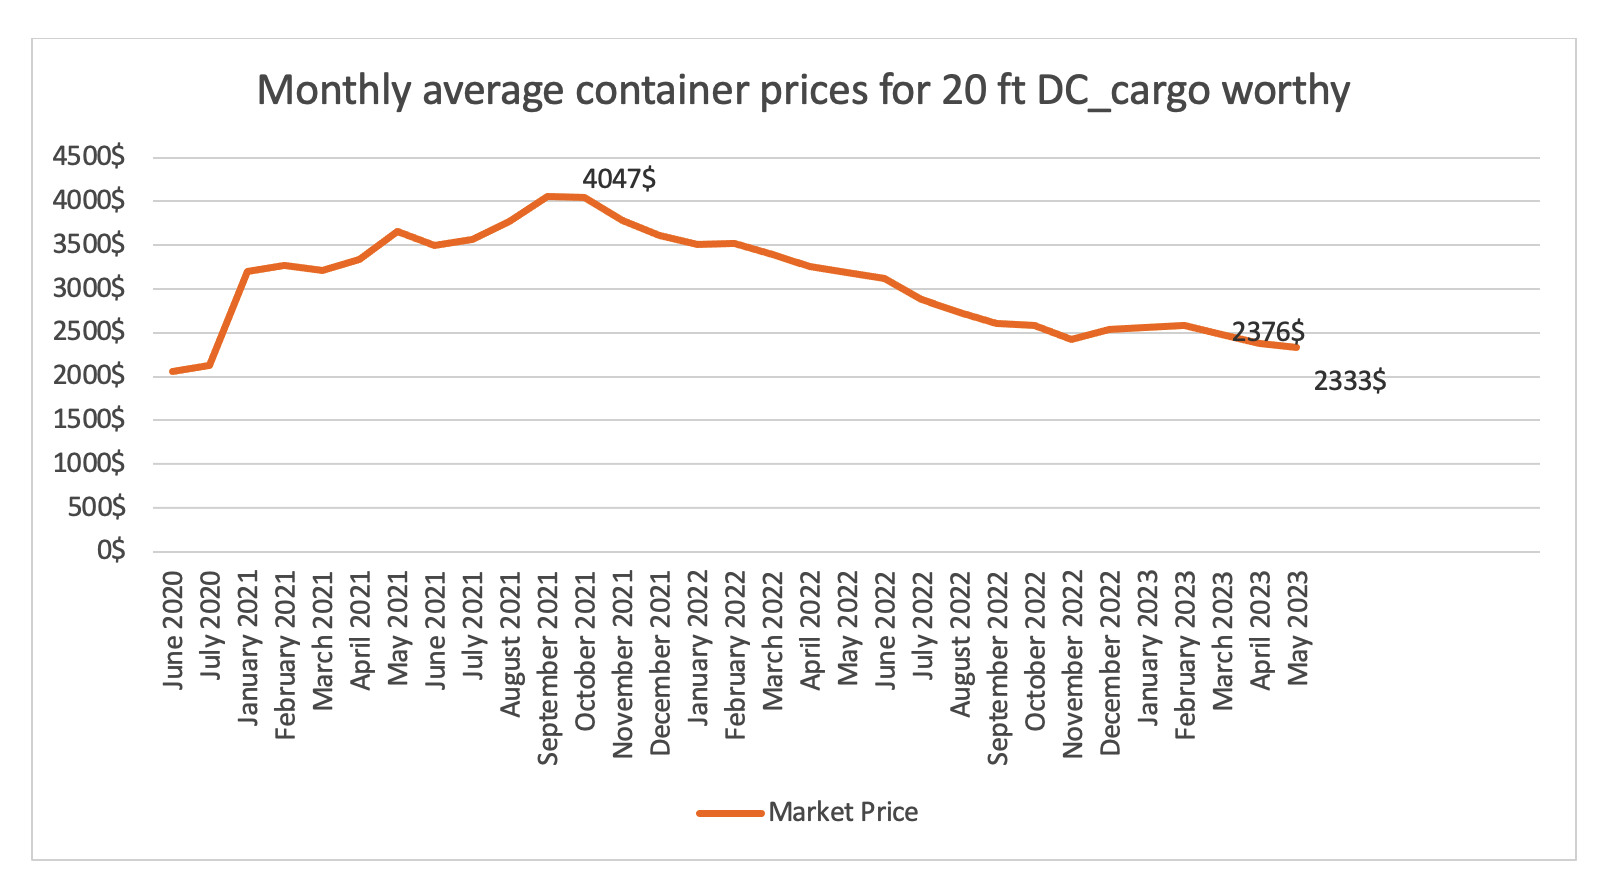
Chart 1: Average price 20 ft DC Cargo-worthy in Shanghai
We see a similar trend of long-term decline across other ports in China like Qingdao, Shenzhen, Tianjin and Guangzhou. However, if we look at the trend of average container prices in China in the past 6 months, then the graph remains flat for most of the ports in China. For some ports like Quingdao, the average prices for 20 ft DC brand new containers increased from $2264 in week 17 to $2486 in week 18 in 2023.
Here is a comparison of the price volatility across different regions globally –

Chart 2: Price volatility tracker-Container xChange Insights
If you see in Chart 2, the container prices by region, we notice that the prices are not sliding significantly, in fact, they are changing very marginally, almost negligible across all the regions. This shows that the prices are not further sliding and this in turn also could potentially mean that the volatility in terms of container prices is significantly reduced globally now. However, we do understand through the May survey we conducted and reported in our May edition of the Forecaster that there could be larger impacts that could disrupt the shipping industry.
- Container availability index (CAx)
Exports to imports ratio stagnate for China. While exports to Europe and to the US declined, exports to Russia stayed strong. Peak season demand yet to kick off in Shanghai. Our Container availability index shows that the inbound containers in China are in majority if compared to outbound containers across key ports. A higher consistent value of CAx is determined by higher inbounds as compared to lower outbounds.
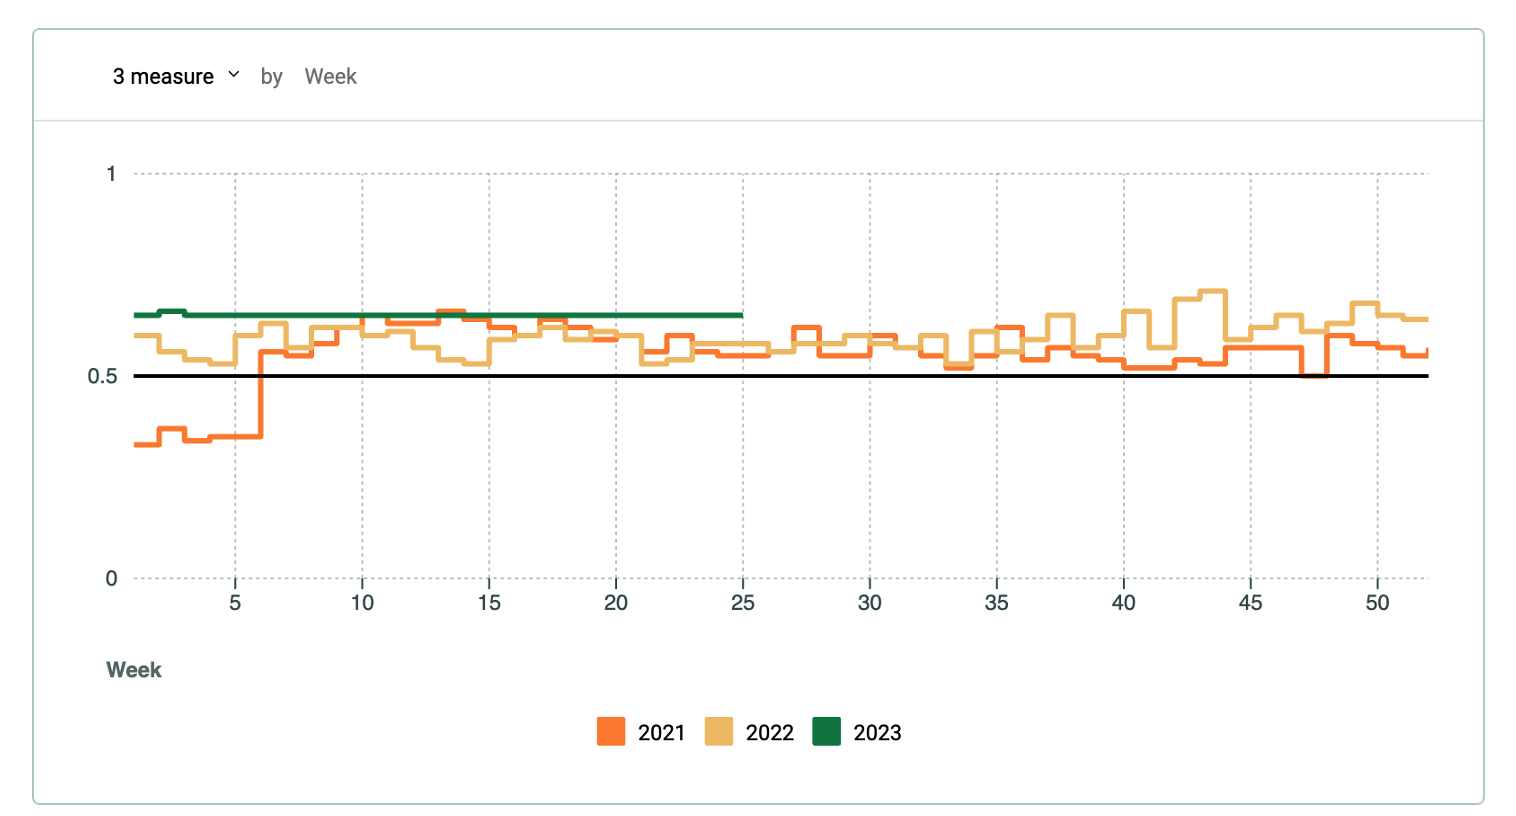
Chart 3: CAx Shanghai
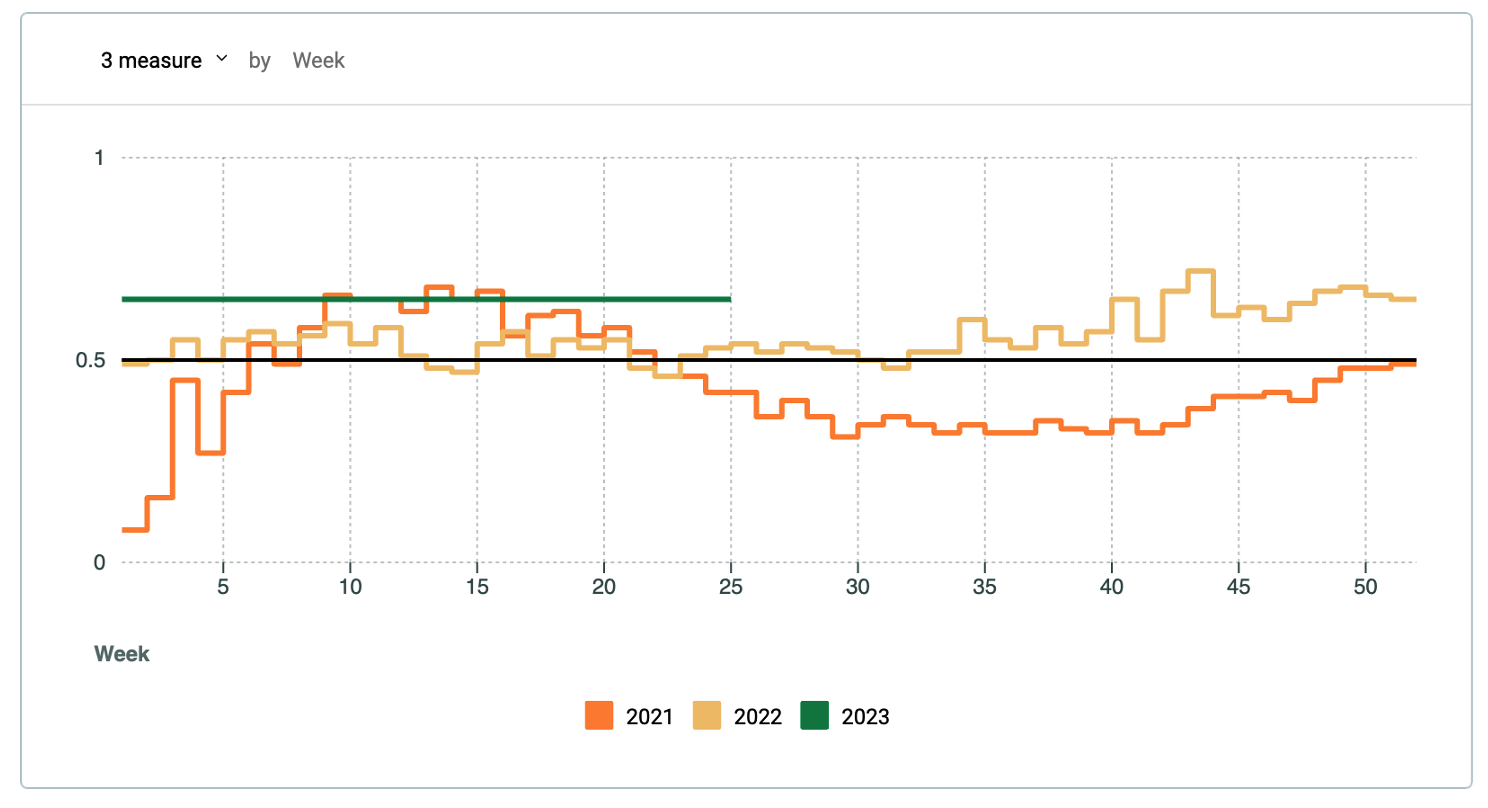
Chart 3: CAx Ningbo
For market updates from other regions, please download the June edition of the monthly container logistics report by Container xChange titled ‘Where are all the containers’ from here – https://shorturl.at/amFQ7
Source: Container xChange



Related News.

Cyprus Maritime Innovation takes Centre Stage at SMM Hamburg 2026
Underscoring its expanding role as a premier international hub for cutting-edge maritime technology and sustainable shipping, the Republic of Cyprus…

Trump seeks to refill US oil reserve with Venezuela deal but faces long delay
U.S. President Donald Trump said on the 30th (local time) that he would refill the U.S. Strategic Petroleum Reserve, which has been depleted with…
US Navy Official visits South Korean Shipyards in private
With U.S. President Donald Trump pushing a plan to allow overseas construction of U.S. warships, attention is focusing on whether the building of…

SES and De Boer Marine expand collaboration with FlexMaritime deployment across Global Markets
SES, a leading space solutions company, and De Boer Marine, a leading provider of top-quality marine equipment and maritime connectivity services,…

New ESG guidance to help maritime industry turn sustainability into commercial advantage
New framework helps shipowners and ports align ESG strategy with access to capital, charterer expectations and long-term asset value. Maritime…

Britannia P&I Club analysis finds four in five crew deaths linked to illness rather than accidents
New report highlights cardiovascular disease as leading cause of fatalities and raises concerns over mental health risks among younger seafarers.…

The Swedish Club launches new Loss Prevention podcast, Knot Another Lesson
The Swedish Club has launched Knot Another Lesson, a new podcast exploring the practical lessons, emerging risks and operational challenges shaping…

Lloyd’s Register appoints Jens Grunenberg as Senior Representative for Germany
Lloyd’s Register has appointed Jens Grunenberg as its Senior Representative for Germany, effective 1 September. Based in Hamburg, Grunenberg will…

Indian Register of Shipping sets sights on Hamburg for European Expansion
Indian Register of Shipping, a leading international classification society and full member of the International Association of Classification…

MOL completes Merger of 6 Ship Management Companies
Unifying Management of Over 200 Vessels and Strengthening Safety Mitsui O.S.K. Lines, announced that it has completed the integration of the MOL…
Subscribe to our newsletter!
if you dont want to swim alone in the ocean of news, sign up for the newsletter, and you will receive daily all the important news of world shipping!
