Panamax in Focus — Pacific Routes gain as the index eases and China-Bound Thermal Coal Flows Weaken


Panamax earnings ease but remain elevated; demand-to-supply ratio falls to 0.91. The BPI fell 41 points week-on-week to 2,407 on 11 September, while P5TC earnings declined by $373 to $21,662/day. Overall earnings held firm in the 96th percentile of weekly benchmarks over the past 52 weeks. On the demand-to-supply series,, tonne-mile demand was 6.9% lower year on year while available tonnage was 2.1% higher, taking the ratio to 0.91 from 0.94.
The Pacific routes rose while the Atlantic fell. P5_82, the South China/Indonesian round, rose $1,145 to $20,339 a day, and P3A_82, the Hong Kong–South Korea transpacific, rose $569 to $22,163 a day. In the Atlantic, P1A_82 fell $1,273 to $20,077 a day, and P2A_82 fell $690 to $30,703 a day. The Panamax ballaster count stood at 812 on 11 September, with 222 vessels in Australasia and 182 in FEAST/NOPAC.
Thermal coal flows to China fell in July–August, with Indonesian volumes declining faster than total flows. China-bound thermal coal flows decreased by 12.1% year on year in July and 17.1% in August 2026. Flows from Indonesia fell more sharply, by 18.2% and 35.7%, respectively. Indonesia accounted for 55.2% of total recorded thermal coal flows to China during the two months, down from 65.2% in the same period of 2025 — a decline of 10 percentage points.
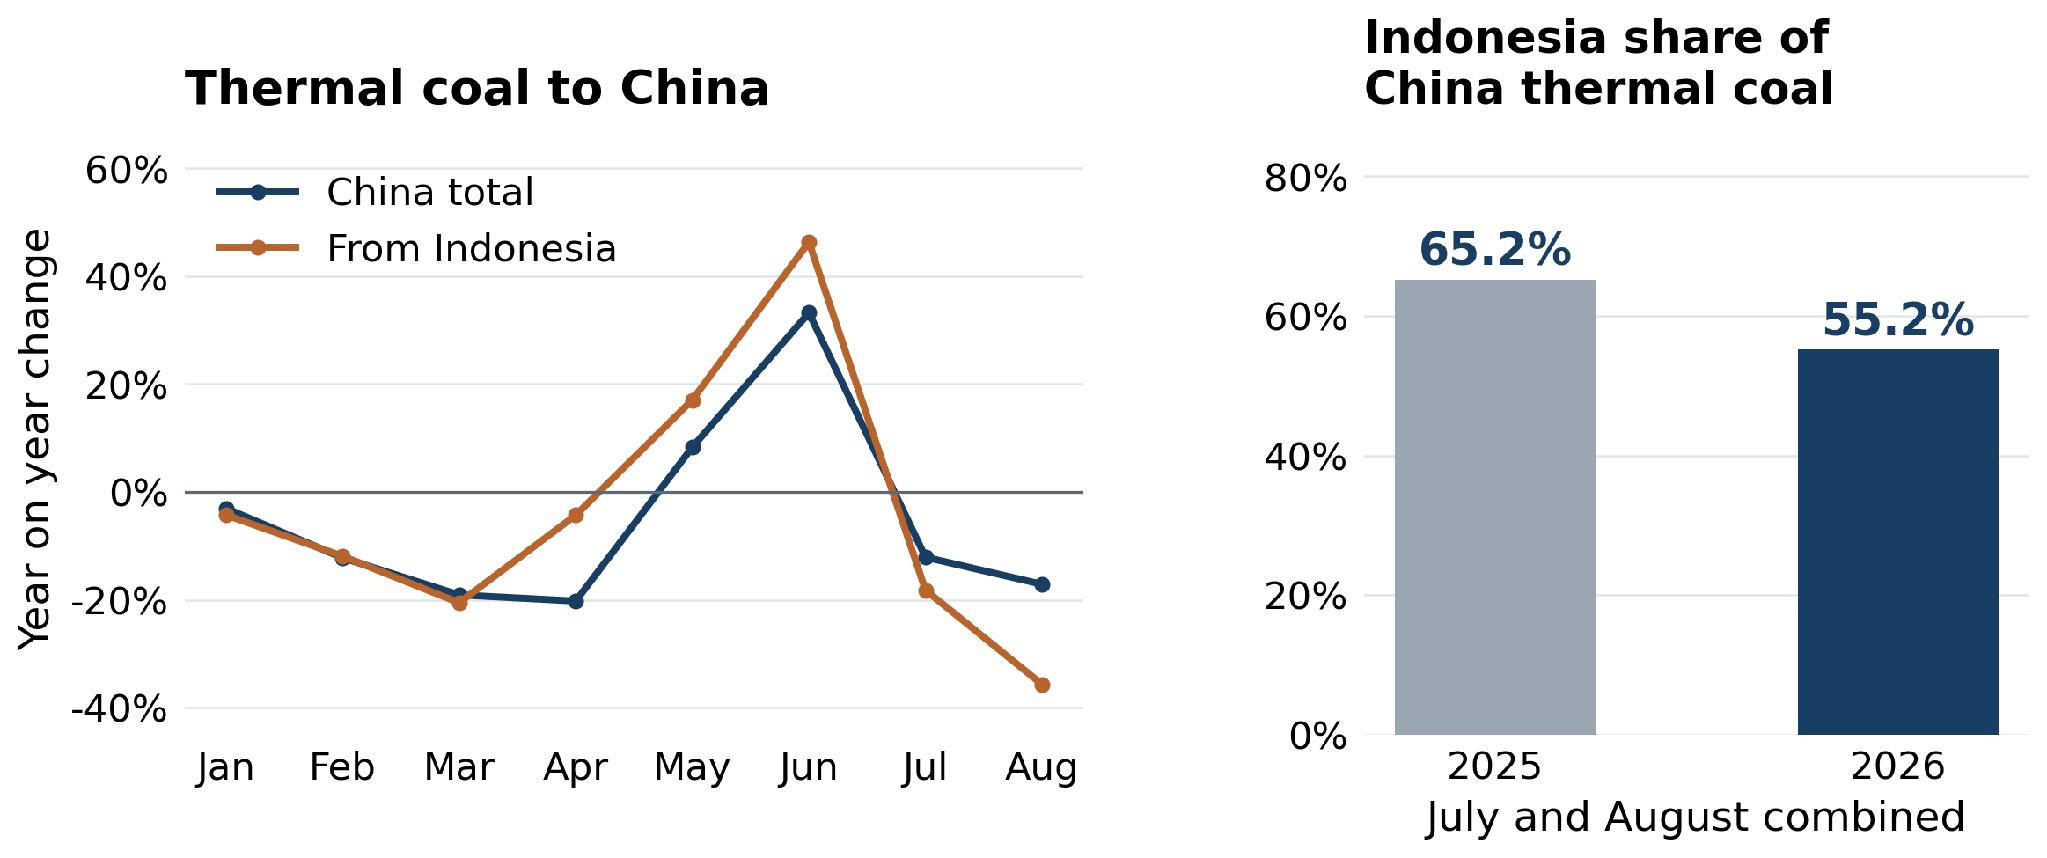
Coal demand is holding up more strongly than previously expected. The IEA’s September outlook forecasts global consumption rising 1.2% to a record 8.94 billion tonnes in 2026, with China’s demand increasing 1% to about 5 billion tonnes. Higher LNG prices have supported coal use in power generation, while higher oil prices have encouraged coal use in China’s chemical industry. El Niño is also expected to increase cooling needs and reduce hydropower availability in some Asian markets, particularly India and Vietnam. China’s latest monthly figures, however, show a mixed picture. NBS data released on 15 September show raw coal production falling 7.7% year on year in August, a narrower decline than in July, taking the January–August decline to 3.3%. Thermal power generation fell by 4.3% in August, a wider decline than in July, while hydropower increased 2.8%. Domestic coal supply remains below last year’s levels, but the power-generation figures do not yet show a sustained increase in thermal demand.
The IEA expects domestic mine output to recover during the remainder of the year and describes inventories at major ports and power plants as healthy. Its full-year forecast still puts China’s seaborne thermal coal imports at 310 million tonnes, down 4.6% from 2025, reflecting inventory use and increased supplies from Mongolia. For autumn and winter, stronger heating demand could support renewed seaborne buying if domestic supply and available stocks cannot cover the increase in consumption. The scale of any recovery will also depend on imported coal’s price advantage against domestic supplies. A seasonal increase in China-bound thermal coal flows therefore remains possible, although the evidence does not yet establish a return to year-on-year growth.
FREIGHT MARKET OVERVIEW | BDI & SEGMENT METRICS
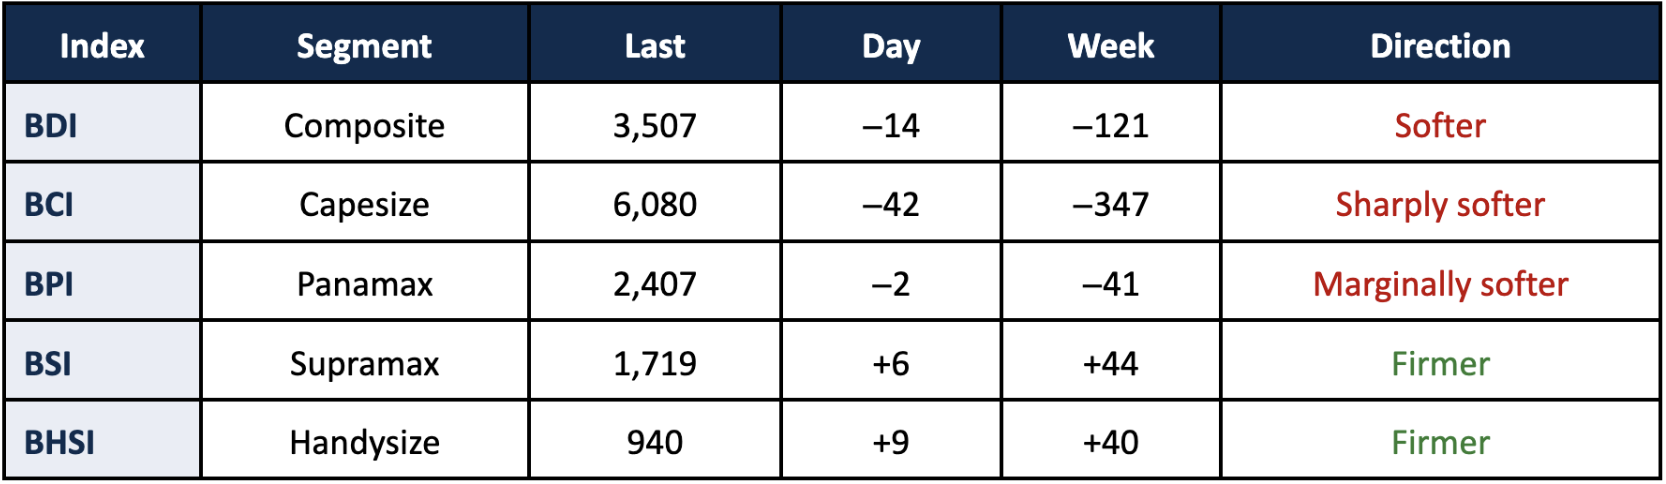
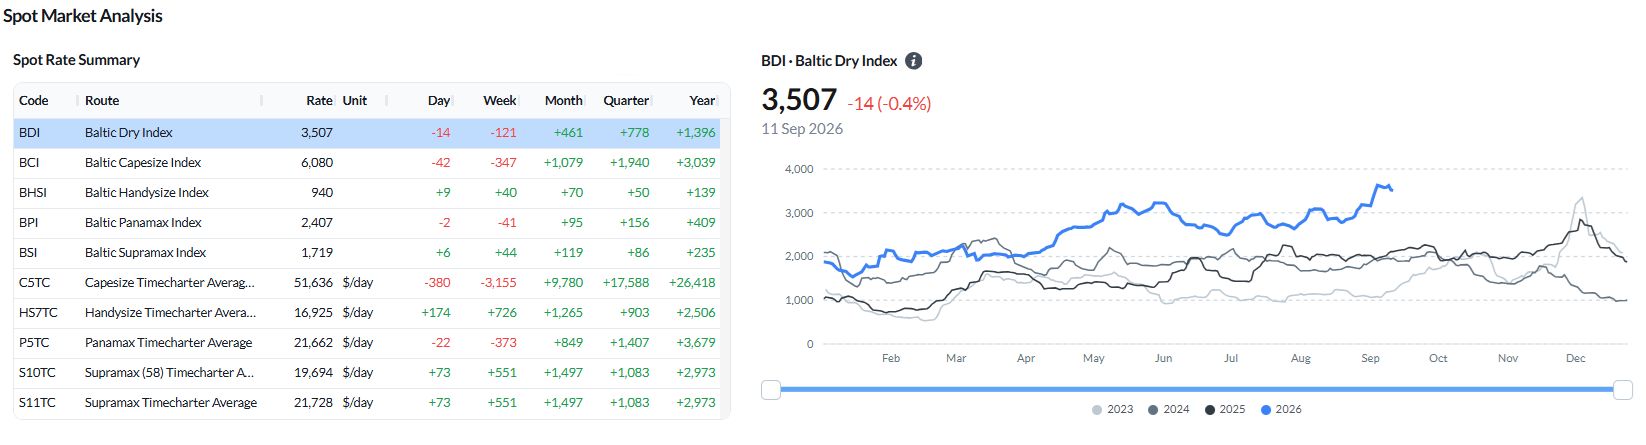
The larger sizes gave back part of their recent gains. The BDI eased to 3,507 points (−14 daily, −121 WoW). Capesize led the decline, with the BCI falling to 6,080 (−347 WoW) and the C5TC average, on the 180,000 dwt basis, down to $51,636/day (−$3,155 WoW). Panamax was marginally lower (BPI 2,407, −41 WoW) with P5TC at $21,662/day (−$373 WoW). The geared sizes moved the other way: Supramax firmed (BSI 1,719, +44 WoW) with S11TC at $21,728/day (+$551 WoW) and Handysize rose (BHSI 940, +40 WoW) with HS7TC at $16,925/day (+$726 WoW).
Ballasters – by region

Supramax carried the largest open tonnage pool of the geared segments at 731 vessels, with 217 in FEAST/NOPAC and 200 in Australasia. Panamax stood at 812, its largest regional pools being Australasia at 222 and the Indian Ocean/South Africa at 213. Handysize totalled 706, with the North Atlantic including Med/Black Sea the largest single pool at 204. Capesize was the smallest fleet at 604, of which 234 were positioned in Australasia.
CAPESIZE | ANALYSIS
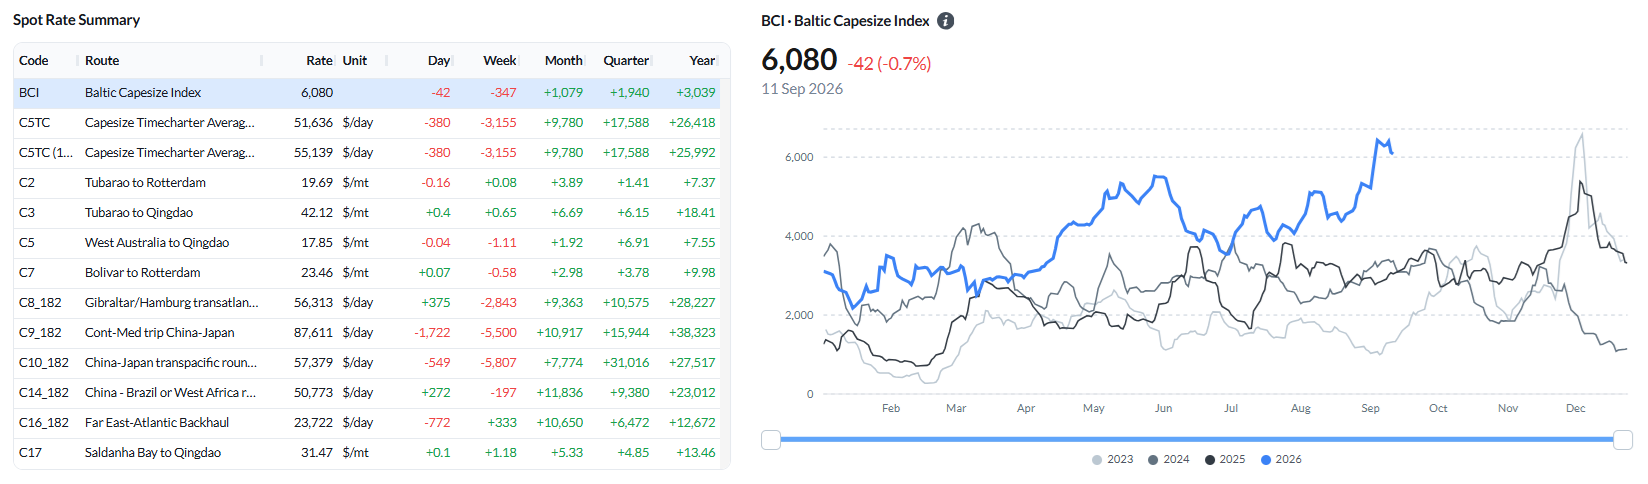
Freight. The BCI eased to 6,080 (−42 day-on-day; −347 week-on-week), with the C5TC average, on the 180,000 dwt basis, at $51,636/day (−$3,155 WoW). The 182,000 dwt weighted average stands at $55,139/day, a differential of $3,503 that follows the Baltic Exchange methodology. The timecharter routes led the decline: C10_182 (China–Japan transpacific round) fell $5,807/day WoW to $57,379/day, C9_182 (Cont–Med trip China–Japan) fell $5,500 to $87,611/day, and C8_182 (Gibraltar/Hamburg transatlantic round) fell $2,843 to $56,313/day. The voyage routes were mixed: C3 (Tubarao–Qingdao) firmed $0.65 to $42.12/mt, C2 (Tubarao–Rotterdam) $0.08 to $19.69/mt and C17 (Saldanha Bay–Qingdao) $1.18 to $31.47/mt, while C5 (West Australia–Qingdao) eased $1.11 to $17.85/mt and C7 (Bolivar–Rotterdam) $0.58 to $23.46/mt.
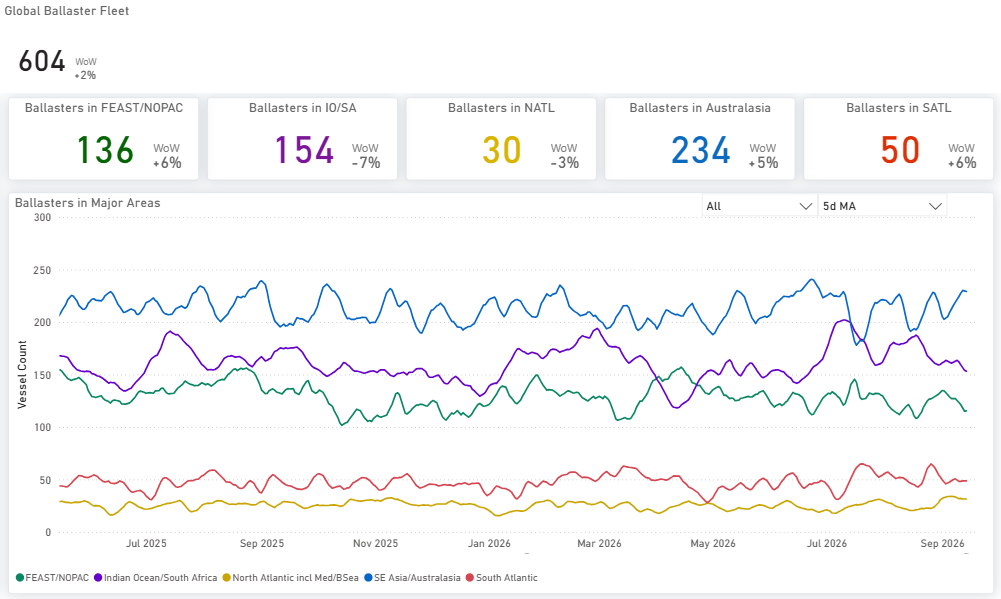
Ballaster positioning. The global Capesize ballaster count stood at 604 on 11 September. Australasia held the largest regional pool at 234, ahead of the Indian Ocean/South Africa at 154 and FEAST/NOPAC at 136. The South Atlantic held 50 and the North Atlantic 30, the smallest pool in the segment.
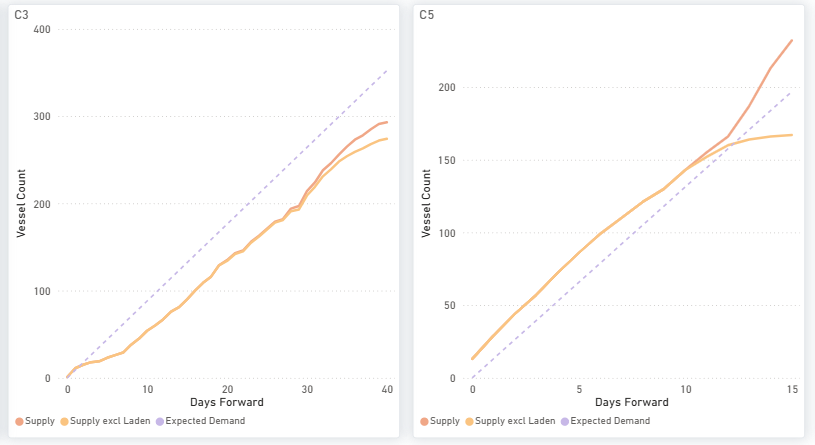
Supply/demand by route. On C3 (Tubarao–Qingdao), the two lines coincide at the start of the window, after which cumulative supply runs below expected demand over the remainder, with the gap widening through roughly the first thirty days and holding to day 40. On C5 (West Australia–Qingdao), total supply is above expected demand from the start; from around day 11 the two supply measures separate, total supply rising steeply to about 235 vessels against expected demand near 197, while supply excluding laden tonnage flattens near 167 and falls below expected demand late in the window.
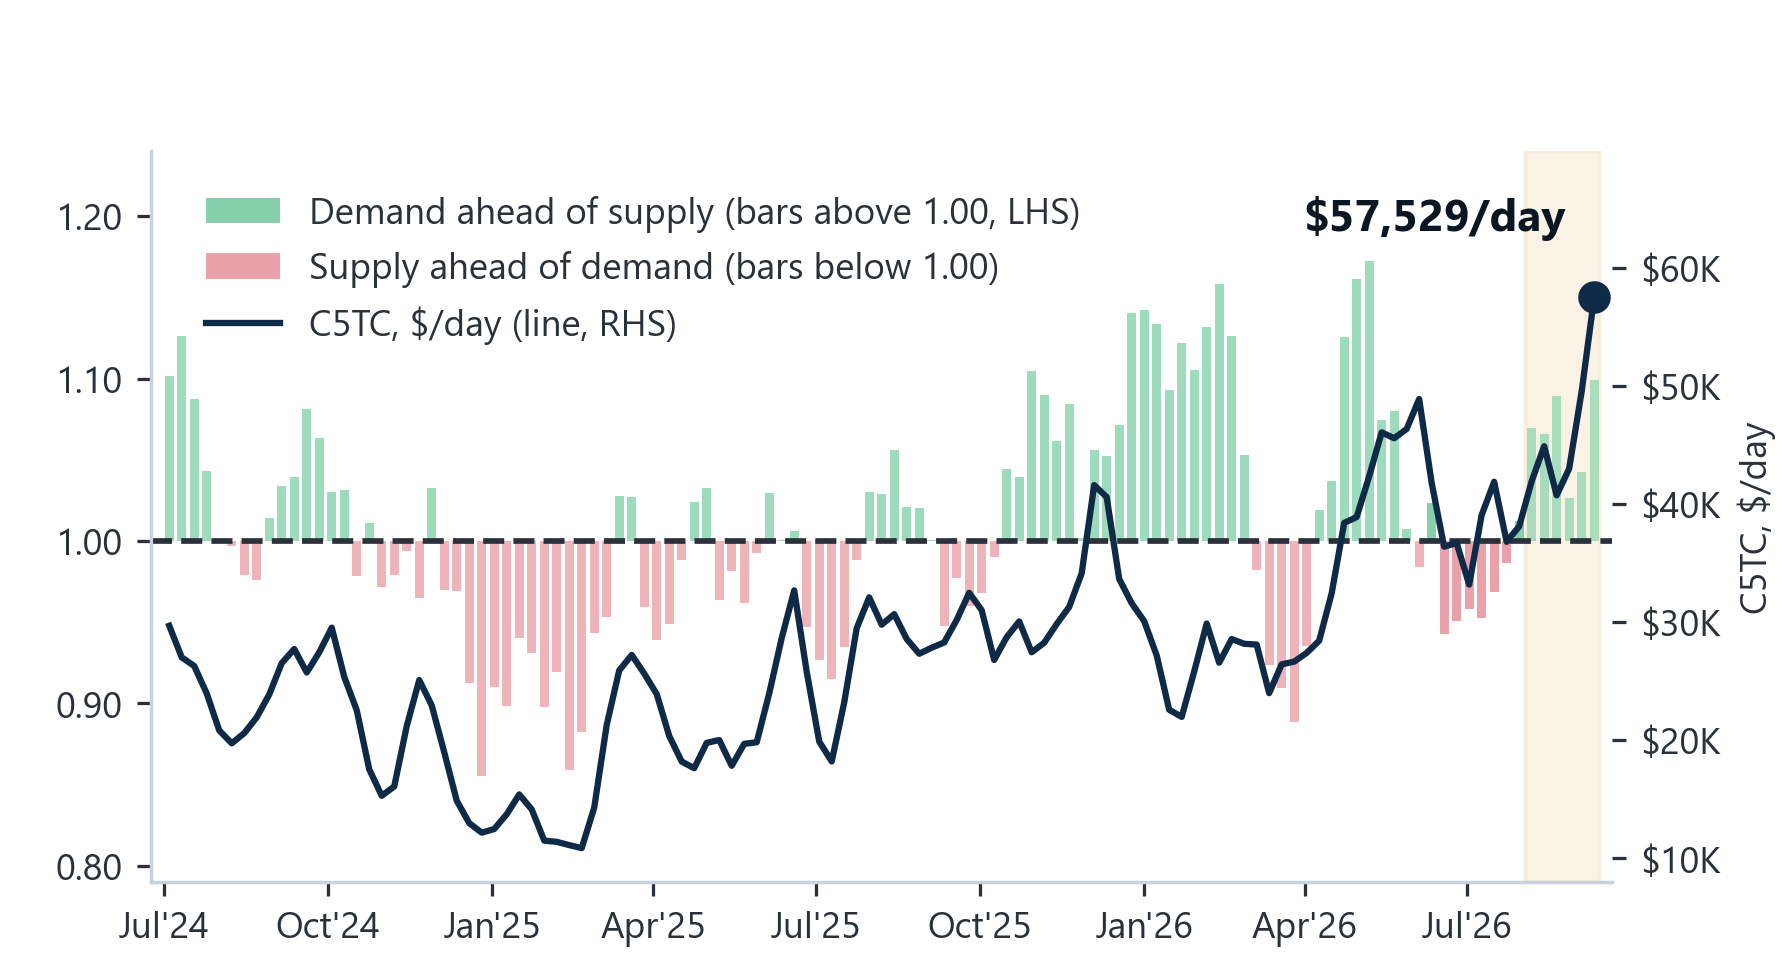
Supply/demand – market-position indicator. On the 11 September assessment, C5TC stands at $51,636 a day (−$3,155 WoW), with earnings close to the top of their 52-week range. On the demand-to-supply series for the week ending 10 September, tonne-mile demand is 7.9% above its year-ago level while available tonnage is 1.8% lower, putting the ratio at 1.10.



Related News.

Hong Kong Global Maritime Trade Summit to return for third edition
The International Chamber of Shipping, in collaboration with the Transport and Logistics Bureau of the Government of Hong Kong and the Hong Kong…

Appetite for US crude oil exports climbs despite high freight
South Korea tops US crude destinations at 568,600 b/d VLCC rates to Asia double, closing arbitrage window European refining margins…

Shipping stocks Rally as Hormuz Traffic plunges 75%
Ship traffic through the Strait of Hormuz — a critical chokepoint handling about 20% of global crude oil and liquefied natural gas shipments — has…

Diana Shipping announces Time Charter Contract for m/v G P Zafirakis with Classic Maritime
Diana Shipping, a global shipping company specializing in the ownership and bareboat charter-in of dry bulk vessels, announced that, through a…

New IMO ESP Code framework for Remote Inspection Techniques
The International Maritime Organisation, through Resolution MSC.584(111) , has adopted amendments to the International Code on the Enhanced…

ABS opens Offshore & Marine Support Center in Bergen
ABS has expanded its capabilities in the Norwegian maritime market with the opening of a cutting-edge support center in Bergen, bringing advanced…
MOL holds giant step memorial ceremony and beach cleanup at Kashima Coast
Memorial and Reflection 20 Years After the Accident: Learning from the Past to Foster an Even Stronger Safety Culture Mitsui O.S.K. Lines, announced…

KEZAD-based Arabian Gulf Steel Industries achieves lowest verified Carbon Footprint for Rebar
CARES UK verified Environmental Product Declaration confirms 139 kg CO₂e per tonne for rebar produced at AGSI’s KEZAD Abu Dhabi facility Arabian…

Indian Register of Shipping announces launch of first fleet support ship INS Surya
Indian Register of Shipping continues to strengthen its role in supporting the Indian Navy and India’s naval shipbuilding capabilities through the…

VLCCs Climbing the Record Charts
LR2 The TC1 75kt MEG/Japan index decreased by only a single point this week to WS928. The corresponding Baltic round-trip TCE fell by $2,000 to…
Subscribe to our newsletter!
if you dont want to swim alone in the ocean of news, sign up for the newsletter, and you will receive daily all the important news of world shipping!
