

Climate TRACE Releases May 2025 Emissions Data
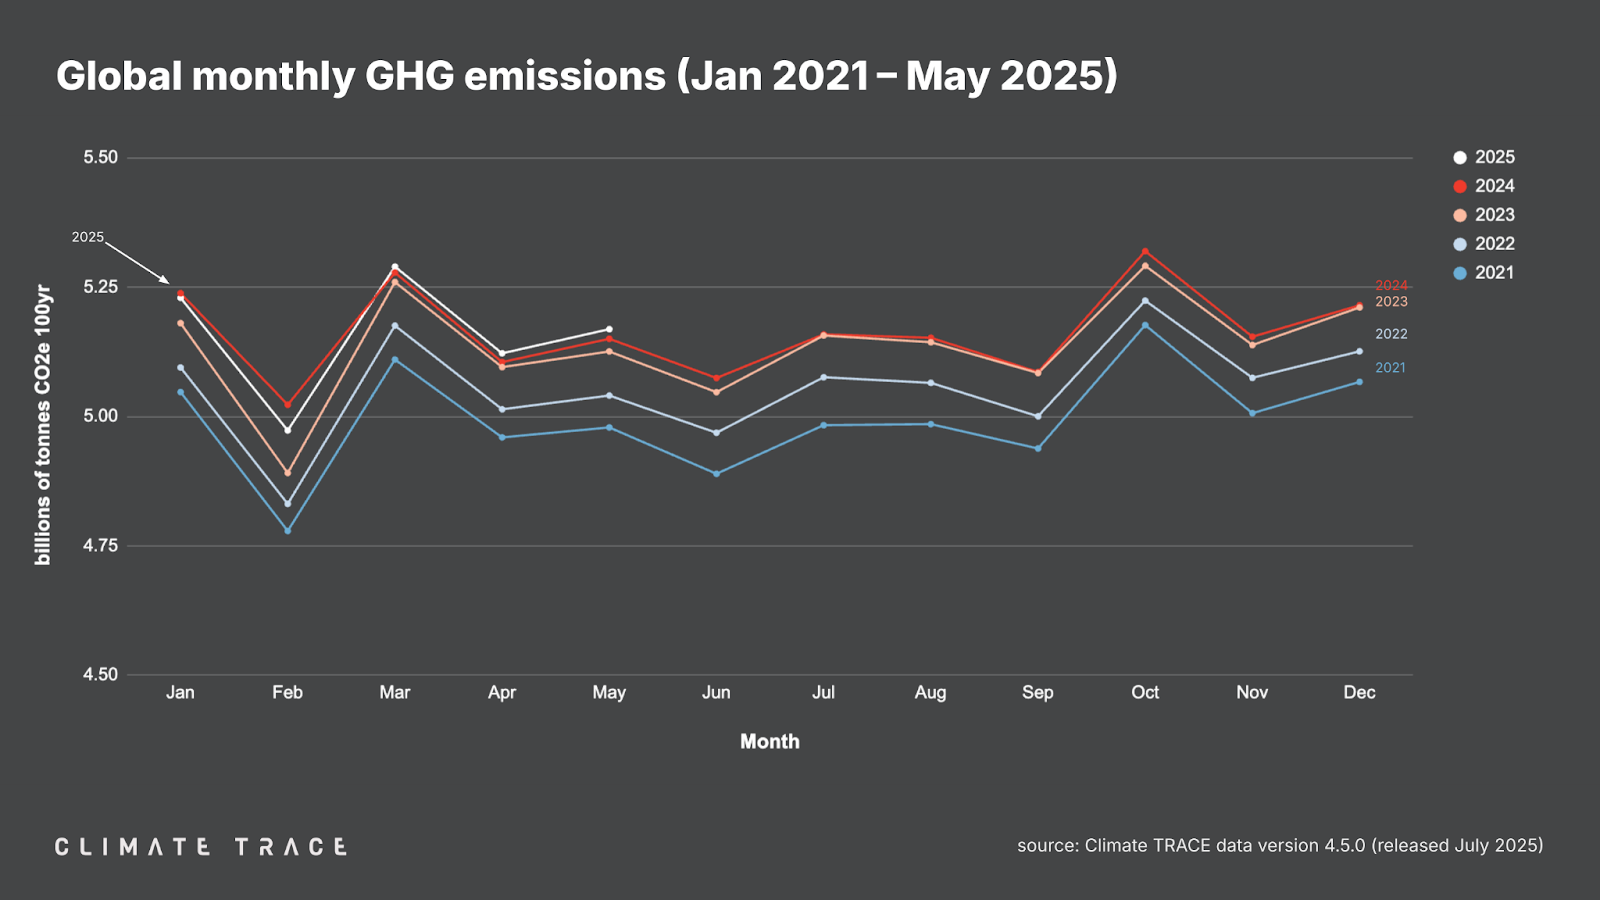
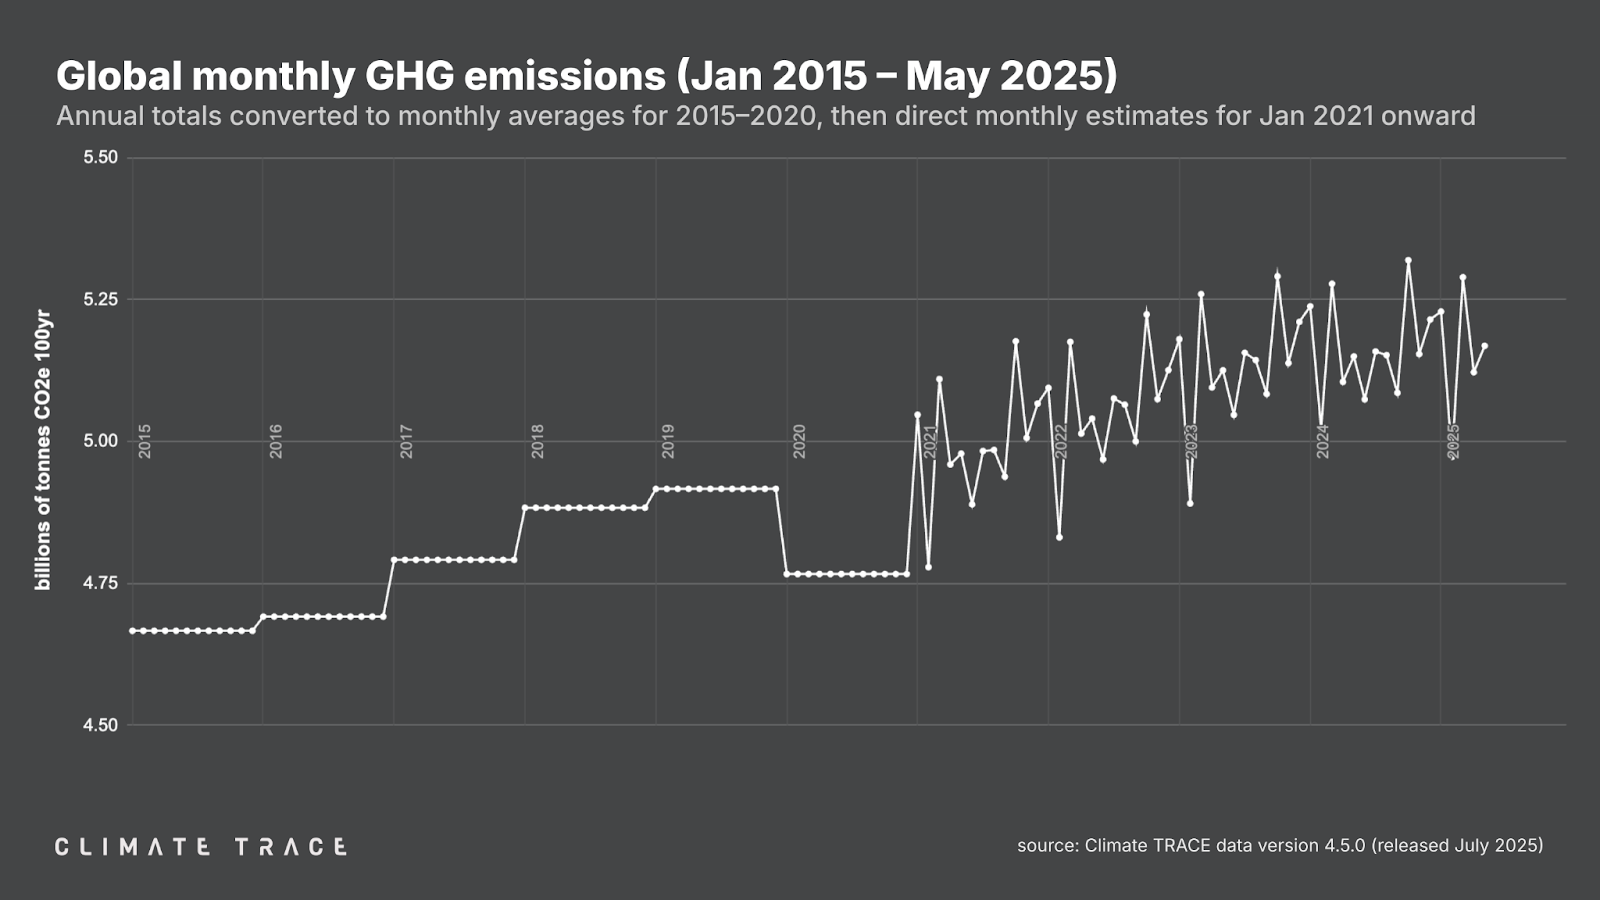
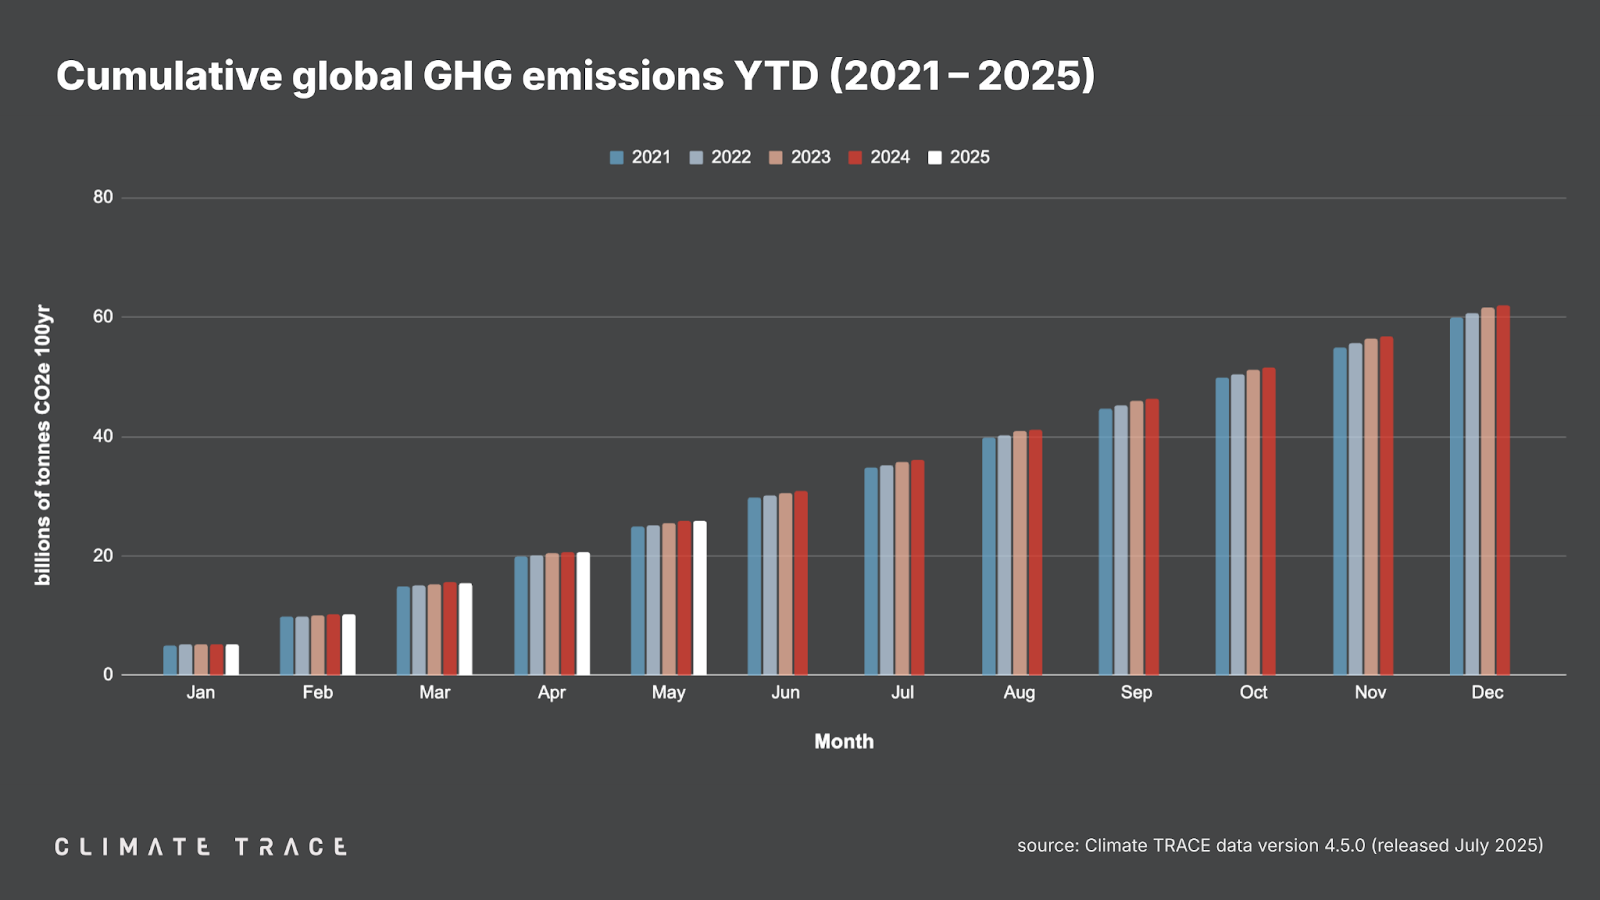
Climate TRACE reported that global greenhouse gas emissions for the month of May 2025 totaled 5.17 billion tonnes CO2e. This represents an increase of 0.36% vs. May 2024. Total global year-to-date emissions are 25.78 billion tonnes CO2e. This is 0.04% lower than the previous year-to-date total. Global methane emissions in May 2025 were 33.99 million tonnes CH4, an increase of 0.63% vs. May 2024.
Data tables summarizing emissions totals for May 2025 by sector, country, and top 100 urban areas are available for download here.
Greenhouse Gas Emissions by Country: May 2025
Climate TRACE’s preliminary estimate of May 2025 emissions in China, the world’s top emitting country, is 1.47 billion tonnes CO2e — a decrease of 1.18 million tonnes CO2e or 0.08% vs. May 2024.
Of the other top five emitting countries:
- United States emissions increased by 2.68 million tonnes CO2e, or 0.48% year over year;
- India emissions increased by 0.23 million tonnes CO2e, or 0.06% year over year;
- Russia emissions increased by 0.94 million tonnes CO2e, or 0.37% year over year;
- Indonesia emissions increased by 0.16 million tonnes CO2e, or 0.11% year over year.
In the EU, which as a bloc would be the fourth largest source of emissions in May 2025, emissions increased by 1.24 million tonnes CO2e compared to May 2024, or 0.39%.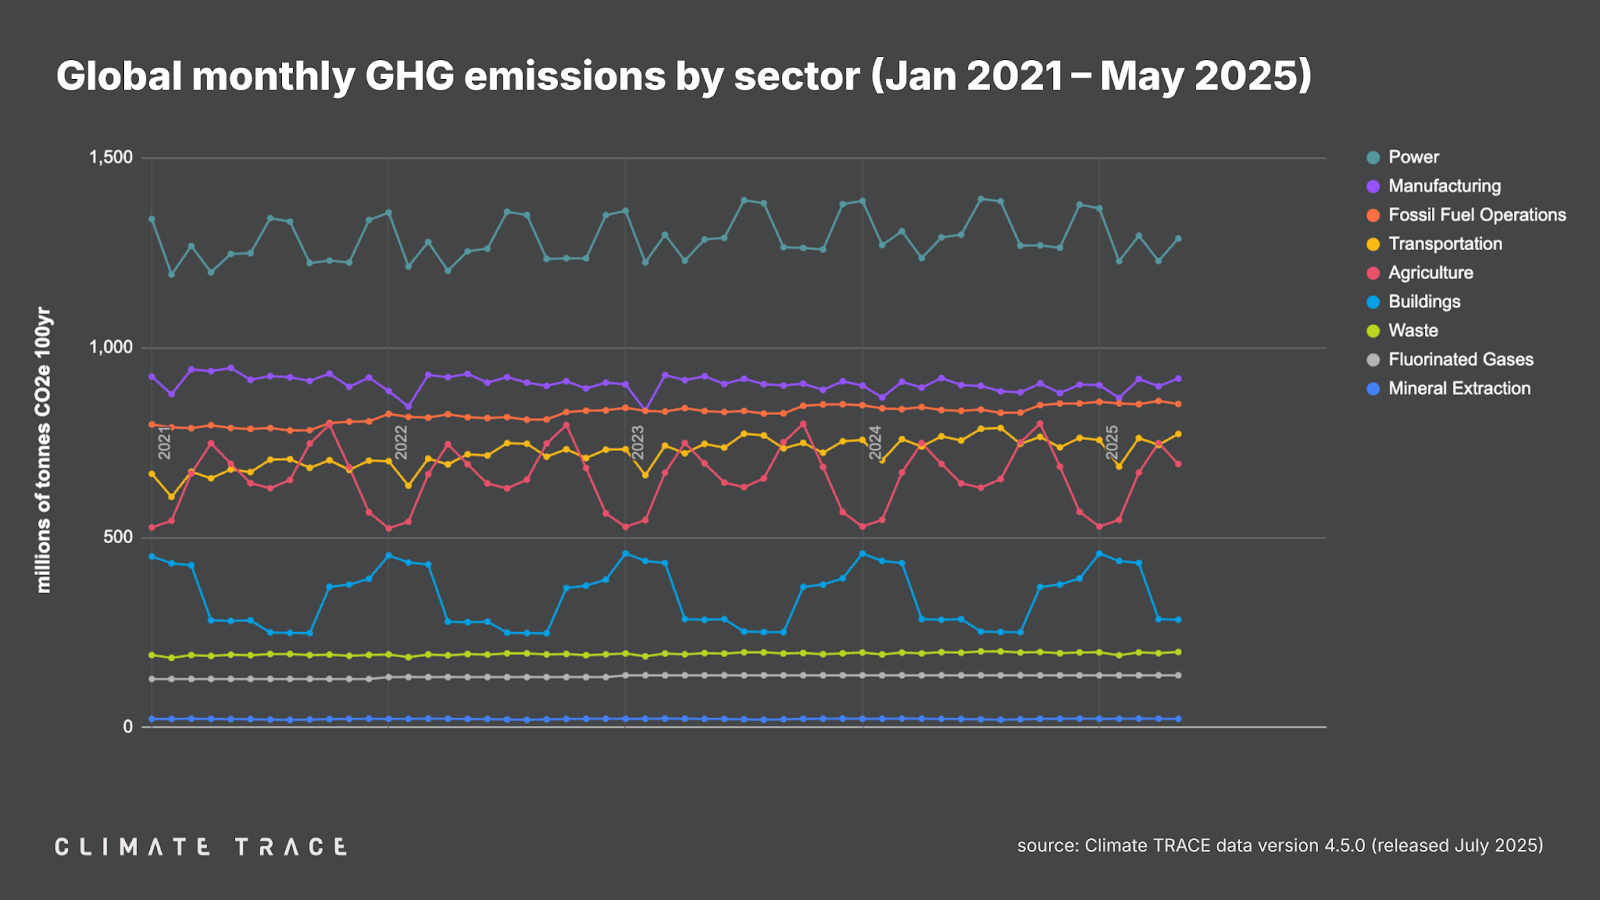
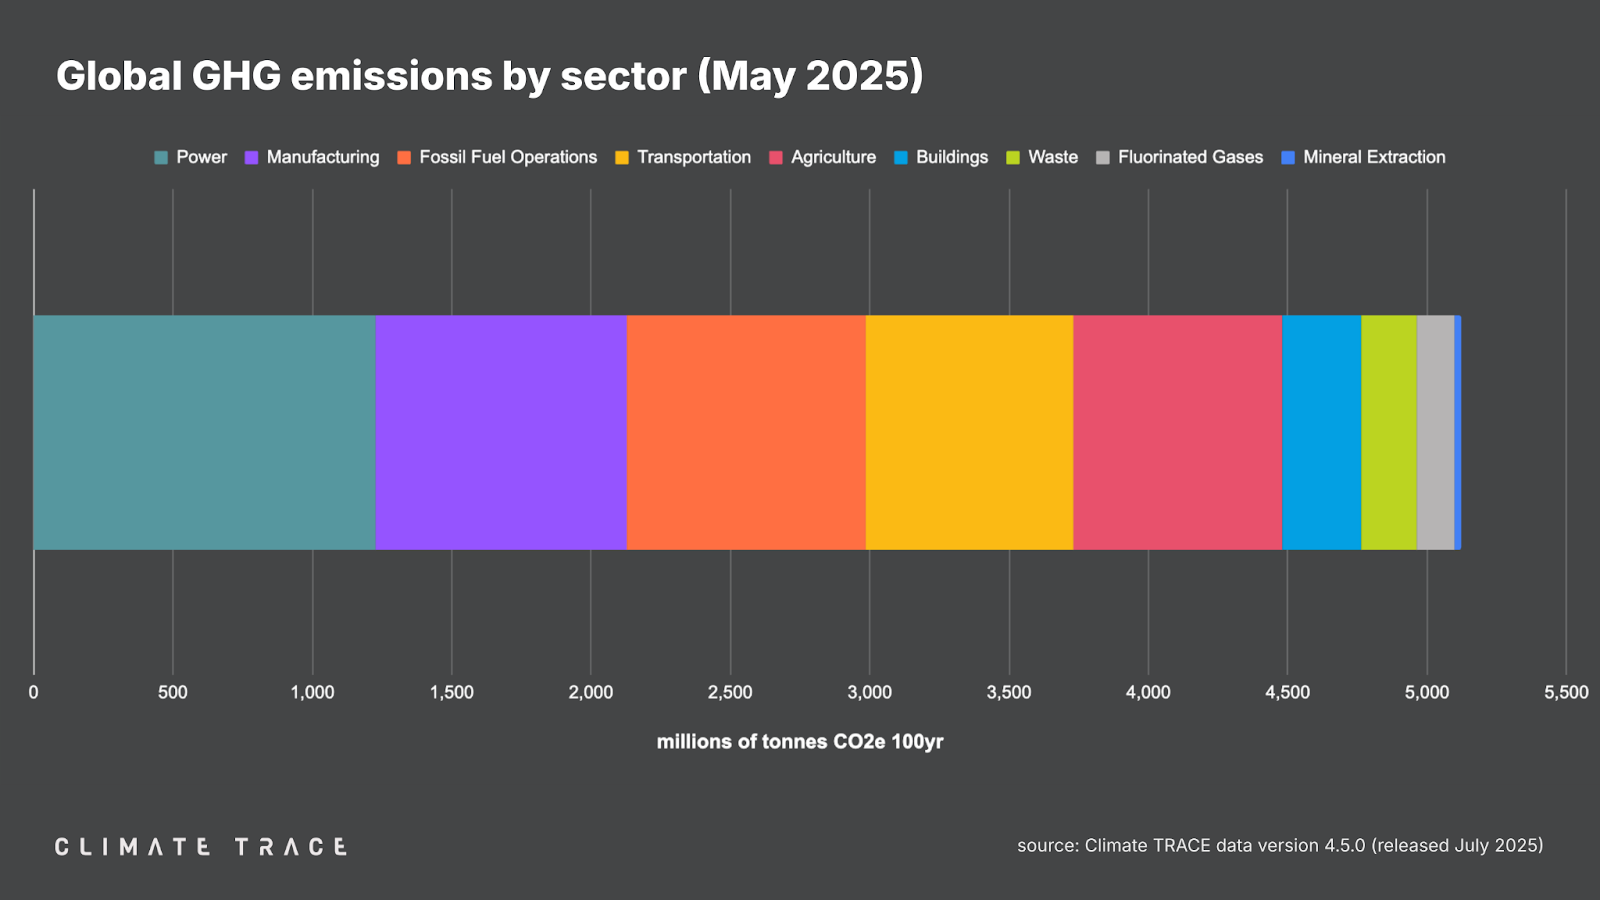
Greenhouse Gas Emissions by Sector: May 2025
Greenhouse gas emissions increased year over year in fossil fuel operations, transportation, and waste, and decreased in manufacturing and power. Fossil fuel operations saw the greatest change in emissions year over year, with emissions increasing by 1.89%.
- Agriculture emissions were 693.99 million tonnes CO2e, unchanged vs. May 2024;
- Buildings emissions were 283.98 million tonnes CO2e, unchanged vs. May 2024;
- Fluorinated gases emissions were 137.71 million tonnes CO2e, unchanged vs. May 2024;
- Fossil fuel operations emissions were 851.59 million tonnes CO2e, a 1.89% increase vs. May 2024;
- Manufacturing emissions were 918.92 million tonnes CO2e, a 0.12% decrease vs. May 2024;
- Mineral extraction emissions were 22.99 million tonnes CO2e, unchanged vs. May 2024;
- Power emissions were 1,287.30 million tonnes CO2e, a 0.23% decrease vs. May 2024;
- Transportation emissions were 772.99 million tonnes CO2e, a 0.81% increase vs. May 2024;
- Waste emissions were 199.15 million tonnes CO2e, a 0.27% increase vs. May 2024.
Greenhouse Gas Emissions by City: May 2025
The urban areas with the highest total greenhouse gas emissions in May 2025 were Shanghai, China; Tokyo, Japan; New York, United States; Los Angeles, United States; and Houston, United States.
The urban areas with the greatest increase in absolute emissions year over year were Owensboro, United States; Pittsburgh, United States; Katowice, Poland; Dortmund, Germany; and Xinyu, China. Those with the largest absolute emissions decline were Swansea, United Kingdom; Singapore, Singapore; Tangshan, China; Houston, United States; and Anchorage, United States.
The urban areas with the greatest increase in emissions as a percentage of their total emissions were Tobelo, Indonesia; Kombissiri, Burkina Faso; Manzil Bourguiba, Tunisia; Porto Amboim, Angola; and Gambat, Pakistan. Those with the greatest decrease by percentage were Swansea, United Kingdom; Moroni, Comoros; Klaipėda, Lithuania; Shitang, China; and Kimbe, Papua New Guinea.
RELEASE NOTES
Revisions to existing Climate TRACE data are common and expected. They allow us to take the most up-to-date and accurate information into account. As new information becomes available, Climate TRACE will update its emissions totals (potentially including historical estimates) to reflect new data inputs, methodologies, and revisions.
With the addition of May 2025 data, the Climate TRACE database is now updated to version V4.5.0. This release introduced major improvements to cement sector data, which now includes information from Global Energy Monitor (GEM)’s Global Cement and Concrete Tracker, resulting in changes to global emissions totals, asset-level activity data, and emissions factors.
Additionally, all historical oil and gas production and transport data was updated with new modeling on lifecycle emissions and changes to input data sources.
Other updates include: the addition of monthly, country-level data for crop residues; the addition of Q1 2025 data in the following forestry subsectors: land clearing, land degradation, forest fires, shrubgrass fires, wetland fires, and through May 2025 for water reservoirs; the incorporation of improved spatial data for water reservoirs; the addition of Q3 2024 asset-level data for oil refineries and steam cracking petrochemical assets; and the addition of asset-level data for rice production in 15 countries.
A detailed description of data updates is available in our changelog here.



Related News.

Navigating the Multi-Orbit Era: In Conversation with Intellian’s Jon Harrison at SMM 2026
At SMM 2026 in Hamburg, the rapid evolution of maritime satellite communications took centre stage. Across the exhibition halls, discussions among…

Cyprus ports need joint energy and investment strategy, shipping agents chief says
Cyprus needs a coordinated strategy for shipping, energy and environmental protection to support port investment and modernisation, Cyprus shipping…

MASO Public Affairs introduces MASO Regulatory Intelligence
A new subscription service helping businesses understand what is changing and what it means for them MASO Public Affairs introduces MASO Regulatory…

Anglo-Eastern helps turn CMBTECH’s ammonia ambition into an operational reality
From early feasibility study and risk-based design to newbuilding supervision, crew readiness and technical management, Anglo-Eastern drew on its…

Escalation of attacks threatens to derail recovery in Middle East oil exports
World oil demand is forecast to fall by 2.5 mb/d y-o-y in 4Q26 and 2.6 mb/d on average in 2026. As the Iran war manifests itself through restricted…

New study finds shipping pays twice its share to EU ETS earmarked revenues should triple to help build market for sustainable fuels and technologies
Shipping is responsible for around 10% of EU ETS emissions but pays almost 20% of the ETS bill. Unlike other sectors, it has never received free…

MSARC strengthens maritime mass rescue readiness through training and national live exercise off Dakar, Senegal
Joint MSARC–FHAS programme combines three days of SAR training with a national multi-agency live exercise The Maritime Search and Rescue Council ,…

Sogese report deliveries are still being delayed as container freight rates fluctuate
FOR IMPORTERS Spot rates into the Mediterranean are back at January levels, Far East to Europe reliability sits at pandemic lows, and nearly…

Glencore begins trading on Australian Securities Exchange
Glencore has begun trading on the Australian Securities Exchange under the ASX code GLC. Gary Nagle, Glencore’s CEO, said it was an exciting day for…
BIMCO Shipping Number of the Week
Suez Canal container ship transits exceed 50% of pre-disruption levels "During the first two weeks of October, weekly container ship capacity…
Subscribe to our newsletter!
if you dont want to swim alone in the ocean of news, sign up for the newsletter, and you will receive daily all the important news of world shipping!
