Climate TRACE Releases January 2026 Emissions Data
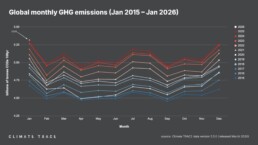

Climate TRACE reported that global greenhouse gas (GHG) emissions for the month of January 2026 totaled 5.3 billion tonnes CO₂e. This represents an increase of 0.3% vs. January 2025. Global methane emissions in January 2026 were 33.5 million tonnes CH₄, a decrease of 1.3% vs. January 2025.
Data tables summarizing GHG and primary particulate matter (PM2.5) emissions totals by sector, country, and the top 100 urban areas for January 2026 are available for download here.
Greenhouse Gas Emissions by Country: January 2026
Climate TRACE’s preliminary estimate of January 2026 emissions in China, the world’s top emitting country, is 1.5 billion tonnes CO₂e, an increase of 4.1 million tonnes of CO₂e, or 0.3% vs. January 2025.
Of the other top five emitting countries:
-
United States emissions declined by 11.8 million tonnes CO₂e, or 1.9% year over year;
-
India emissions increased by 1.6 million tonnes CO₂e, or 0.4% year over year;
-
Russia emissions declined by 1.6 million tonnes CO₂e, or 0.6% year over year;
-
Indonesia emissions declined by 0.3 million tonnes CO₂e, or 0.2% year over year.
In the EU, which as a bloc would be the fourth largest source of emissions in January 2026, emissions increased by 10.5 million tonnes CO₂e compared to January 2025, or 3.2%.
Data on all other countries are available in our Country Inventory.
Greenhouse Gas Emissions by Sector: January 2026
Greenhouse gas emissions increased in January 2026 vs. January 2025 in buildings, transportation, and waste, and decreased in fossil fuel operations, manufacturing, and power. Buildings saw the greatest change in emissions year over year, with emissions increasing by 3.6% as compared to January 2025.
-
Agriculture emissions were 563.9 million tonnes CO₂e, unchanged vs. January 2025;
-
Buildings emissions were 521.0 million tonnes CO₂e, a 3.6% increase vs. January 2025;
-
Fluorinated gases emissions were 145.0 million tonnes CO₂e, unchanged vs. January 2025;
-
Fossil fuel operations emissions were 830.5 million tonnes CO₂e, a 2.4% decrease vs. January 2025;
-
Manufacturing emissions were 859.1 million tonnes CO₂e, a 0.1% decrease vs. January 2025;
-
Mineral extraction emissions were 17.2 million tonnes CO₂e, unchanged vs. January 2025;
-
Power emissions were 1,416.9 million tonnes CO₂e, a 0.4% decrease vs. January 2025;
-
Transportation emissions were 792.3 million tonnes CO₂e, a 2.8% increase vs. January 2025;
-
Waste emissions were 170.3 million tonnes CO₂e, a 0.2% increase vs. January 2025.
Greenhouse Gas Emissions by City: January 2026
The urban areas with the highest total GHG emissions in January 2026 were Shanghai, China; Tokyo, Japan; New York, United States; Los Angeles, United States; and Houston, United States.
The urban areas with the greatest increases in absolute emissions in January 2026 as compared to January 2025 were Anshan, China; Moscow, Russia; Fukuyama, Japan; Anpara, India; and UNNAMED, India. Those with the largest absolute emissions declines between this January and last January were Baotou, China; Songyuan, China; Louxing, China; Nagoya, Japan; and Cincinnati, United States.
The urban areas with the greatest increases in emissions as a percentage of their total emissions were Butibori, India; Karewa, Cameroon; Uruguaiana, Brazil; Chukai, Malaysia; and Sobradinho, Brazil. Those with the greatest decreases by percentage were Macherla, India; Iligan, Philippines; Monclova, México; Louxing, China; and Gushiegu, Ghana.



Related News.

Hong Kong Global Maritime Trade Summit to return for third edition
The International Chamber of Shipping, in collaboration with the Transport and Logistics Bureau of the Government of Hong Kong and the Hong Kong…

Appetite for US crude oil exports climbs despite high freight
South Korea tops US crude destinations at 568,600 b/d VLCC rates to Asia double, closing arbitrage window European refining margins…

Shipping stocks Rally as Hormuz Traffic plunges 75%
Ship traffic through the Strait of Hormuz — a critical chokepoint handling about 20% of global crude oil and liquefied natural gas shipments — has…

Diana Shipping announces Time Charter Contract for m/v G P Zafirakis with Classic Maritime
Diana Shipping, a global shipping company specializing in the ownership and bareboat charter-in of dry bulk vessels, announced that, through a…

New IMO ESP Code framework for Remote Inspection Techniques
The International Maritime Organisation, through Resolution MSC.584(111) , has adopted amendments to the International Code on the Enhanced…

ABS opens Offshore & Marine Support Center in Bergen
ABS has expanded its capabilities in the Norwegian maritime market with the opening of a cutting-edge support center in Bergen, bringing advanced…

MOL holds giant step memorial ceremony and beach cleanup at Kashima Coast
Memorial and Reflection 20 Years After the Accident: Learning from the Past to Foster an Even Stronger Safety Culture Mitsui O.S.K. Lines, announced…

KEZAD-based Arabian Gulf Steel Industries achieves lowest verified Carbon Footprint for Rebar
CARES UK verified Environmental Product Declaration confirms 139 kg CO₂e per tonne for rebar produced at AGSI’s KEZAD Abu Dhabi facility Arabian…

Indian Register of Shipping announces launch of first fleet support ship INS Surya
Indian Register of Shipping continues to strengthen its role in supporting the Indian Navy and India’s naval shipbuilding capabilities through the…

VLCCs Climbing the Record Charts
LR2 The TC1 75kt MEG/Japan index decreased by only a single point this week to WS928. The corresponding Baltic round-trip TCE fell by $2,000 to…
Subscribe to our newsletter!
if you dont want to swim alone in the ocean of news, sign up for the newsletter, and you will receive daily all the important news of world shipping!
