Study scope 3 emissions on the same route can vary tenfold smaller regional vessels emit up to 5X more CO₂ per tonne


- Emissions on the same route can vary tenfold depending on how consistently carriers operate.
- New OceanScore Data Finds four times Emissions Spike from Port Delays
- Smaller regional vessels emit up to 5X more CO₂ per tonne than long-haul ships due to lower utilization and idle time.
- MSC and Arkas Denizcilik lead on efficiency, while others show wider volatility.
OceanScore, world’s leading maritime emissions and compliance data intelligence company, published its latest report titled ‘Scope 3 at Sea: Intra Mediterranean & Black Sea Edition’.
Drawing on more than 45,000 voyages across the Intra Mediterranean & Black Sea corridor, OceanScore found that emissions intensity on the same trade lane can vary by up to ten times, exposing how carrier behavior will directly shape shippers’ financial risk under upcoming EU ETS and FuelEU Maritime rules.
“The same corridor, the same vessel class, yet emissions can range from 9 to over 80 gCO2 per tonne-kilometre,” said Thomas Smith, Head of Cargo Solutions at OceanScore. “That’s not a distance problem – that’s a consistency problem. Voyage-level visibility is what turns those hidden differences into actionable insight for shippers and forwarders.”
“Short-sea operations are far less predictable than long-haul,” said Eduardo Ramos, Senior Data Analyst at OceanScore. “On these routes, every delay or underutilized sailing compound emissions. Without voyage-level data, companies can’t see where their Scope 3 risk – or cost – really comes from.”
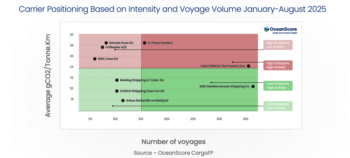
Figure 1. Carrier Positioning in the Intra Mediterranean & Black Sea Corridor (Aug 2025)
OceanScore data shows that while MSC and CMA CGM dominate the corridor by voyage count, carriers like Arkas Denizcilik and Maersk achieve stronger emissions efficiency. High-intensity operators such as X-Press Feeders and Boluda Lines display greater volatility, inflating Scope 3 exposure when used at scale. (Source: OceanScore CargoFP, 2025)
Carrier Consistency: The New Benchmark for Scope 3 Efficiency
Carrier selection makes a clear difference on feeder-dominated routes. Choosing high-volume, lower-intensity operators such as MSC or Arkas Denizcilik can materially reduce Scope 3 exposure, while reliance on higher-intensity feeders like X-Press Feeders or Boluda Lines risks inflating totals despite their smaller share.
OceanScore’s analysis mapped the top feeder operators across the corridor using two metrics – average carbon intensity and voyage consistency (distribution spread).
Carriers with narrower, stable distributions (like MSC, Maersk, and Arkas Denizcilik) offer predictable Scope 3 outcomes, while more volatile operators expose shippers to reporting risk and inflated cost pass-throughs.
“Consistency is the new benchmark,” said Thomas Smith. “You can’t control if a ship sails full or half-empty – but you can choose carriers who operate predictably and efficiently. That’s where real Scope 3 reduction potential lies.”
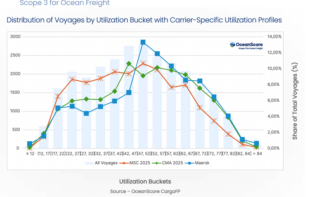
Figure 2. Vessel Utilization and Scope 3 Efficiency Across the Intra Mediterranean & Black Sea Corridor (Jan-Aug 2025)
OceanScore data shows that most voyages operate between 37-67% utilization, with higher load factors corresponding to significantly lower carbon intensity per tonne. CMA CGM maintains the highest proportion of heavily loaded voyages (52-72%), while MSC’s wider spread indicates more variable utilization patterns. Maersk displays the most balanced distribution, with steady clustering in the 57-67% range. (Source: OceanScore CargoFP, 2025)
Utilization Drives Efficiency – and Predictability
On long-haul routes, a vessel operating at 70% utilization emits roughly 20-30% less CO2 per tonne-km than one running at 50%. Across the Intra Mediterranean & Black Sea corridor, the data highlights that MSC shows relatively better efficiency, while CMA CGM carries higher average intensities at a similar voyage count.
Maersk sits between the two, with relatively stable performance but fewer heavily loaded voyages. For shippers and forwarders, this reinforces the case for carrier benchmarking by utilization.
Favoring operators that deliver steadier, higher load factors translates into more predictable Scope 3 reporting and lower carbon-cost exposure over time.
Key findings from the report: Data Summary
| Key Area | Data Point | Takeaway |
| Variability | 9–80 gCO₂/t-km range (10× gap) | Operational consistency drives efficiency, not ship size. |
| Feeder Impact | 40–60 gCO₂/t-km vs 7–16 for larger ships | Feeder volatility inflates Scope 3 totals. |
| Delays | 9.3 → 38.1 gCO₂/t-km (2-day idle) | A single port delay can quadruple emissions. |
| Carrier Performance | Arkas (17.8), MSC (20.3), Maersk (19.8) CMA (24.0), X-Press (30.3), Boluda (30.1) | Consistency matters more than size or distance. |
| Utilization & Speed | 70% load = 20–30% less CO₂; +1 knot = +5% CO₂ | Steady utilization and speed discipline are key reduction levers for Scope 3 emissions. |
| Reporting Accuracy | EU ETS & FuelEU make averages obsolete | Voyage-level data prevents cost overstatement. |
From Compliance to Control
With FuelEU Maritime and EU ETS entering full effect in 2026, carriers are expected to pass carbon costs downstream. OceanScore’s voyage-level data helps stakeholders verify those charges and benchmark cost exposure accurately – turning emissions intelligence from a compliance tool into a commercial advantage.
“Our data gives shippers the power to verify what they’re being charged for,” said Smith. “It’s not about reporting anymore – it’s about control.”



Related News.

Navigating the Multi-Orbit Era: In Conversation with Intellian’s Jon Harrison at SMM 2026
At SMM 2026 in Hamburg, the rapid evolution of maritime satellite communications took centre stage. Across the exhibition halls, discussions among…
Cyprus ports need joint energy and investment strategy, shipping agents chief says
Cyprus needs a coordinated strategy for shipping, energy and environmental protection to support port investment and modernisation, Cyprus shipping…

MASO Public Affairs introduces MASO Regulatory Intelligence
A new subscription service helping businesses understand what is changing and what it means for them MASO Public Affairs introduces MASO Regulatory…
Anglo-Eastern helps turn CMBTECH’s ammonia ambition into an operational reality
From early feasibility study and risk-based design to newbuilding supervision, crew readiness and technical management, Anglo-Eastern drew on its…

Escalation of attacks threatens to derail recovery in Middle East oil exports
World oil demand is forecast to fall by 2.5 mb/d y-o-y in 4Q26 and 2.6 mb/d on average in 2026. As the Iran war manifests itself through restricted…

New study finds shipping pays twice its share to EU ETS earmarked revenues should triple to help build market for sustainable fuels and technologies
Shipping is responsible for around 10% of EU ETS emissions but pays almost 20% of the ETS bill. Unlike other sectors, it has never received free…

MSARC strengthens maritime mass rescue readiness through training and national live exercise off Dakar, Senegal
Joint MSARC–FHAS programme combines three days of SAR training with a national multi-agency live exercise The Maritime Search and Rescue Council ,…

Sogese report deliveries are still being delayed as container freight rates fluctuate
FOR IMPORTERS Spot rates into the Mediterranean are back at January levels, Far East to Europe reliability sits at pandemic lows, and nearly…

Glencore begins trading on Australian Securities Exchange
Glencore has begun trading on the Australian Securities Exchange under the ASX code GLC. Gary Nagle, Glencore’s CEO, said it was an exciting day for…
BIMCO Shipping Number of the Week
Suez Canal container ship transits exceed 50% of pre-disruption levels "During the first two weeks of October, weekly container ship capacity…
Subscribe to our newsletter!
if you dont want to swim alone in the ocean of news, sign up for the newsletter, and you will receive daily all the important news of world shipping!
