LR2s Turn Dirty: Fewer Ships Left in Clean Trades


LR2s Turn Dirty
A Changing Balance in Tanker Employment
SPOTLIGHT · LR2 EMPLOYMENT
Dirty Employment Gains Ground
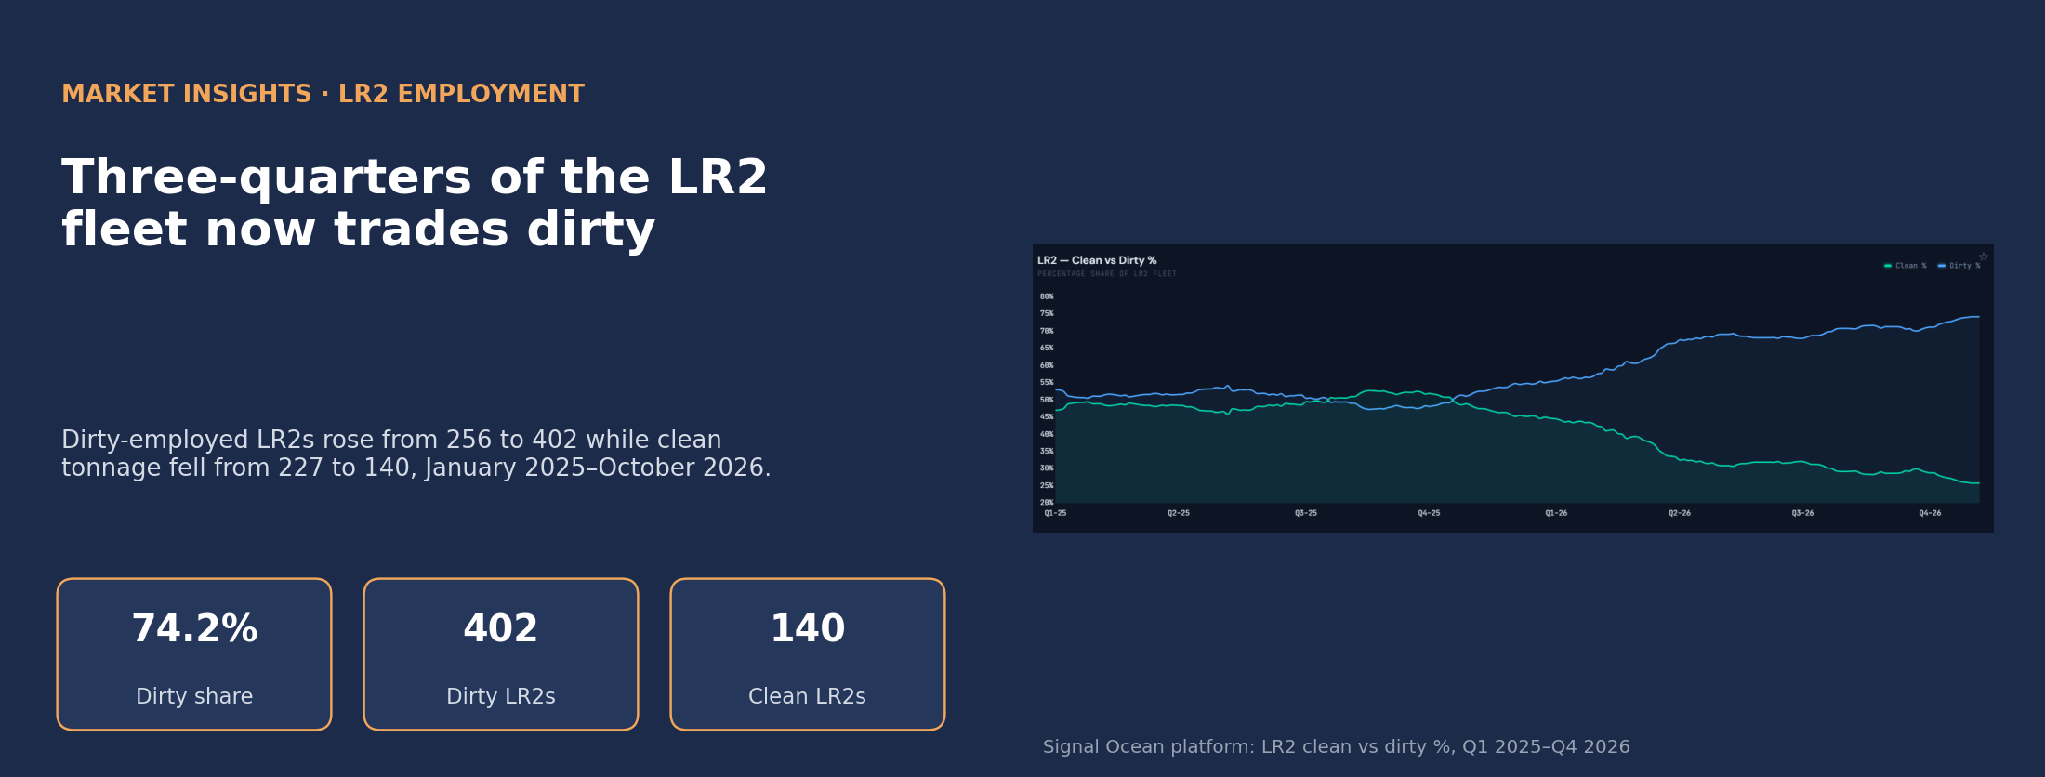
The LR2 market has undergone a marked change in vessel employment since the start of 2025. Signal Ocean data show that dirty employment accounted for 74.2% of the LR2 fleet on 30 October 2026, compared with 53.0% on 1 January 2025. The shift accelerated in 2026, reducing the number of LR2s in clean trades even as the overall fleet expanded.
Dirty-employed LR2s rose from 256 to 402 vessels, an increase of 57%, while clean-employed tonnage fell from 227 to 140, a reduction of 38%. Over the same period, the combined LR2 count grew from 483 to 542 vessels. A larger fleet has therefore delivered fewer clean ships.
LR2 employment at a glance

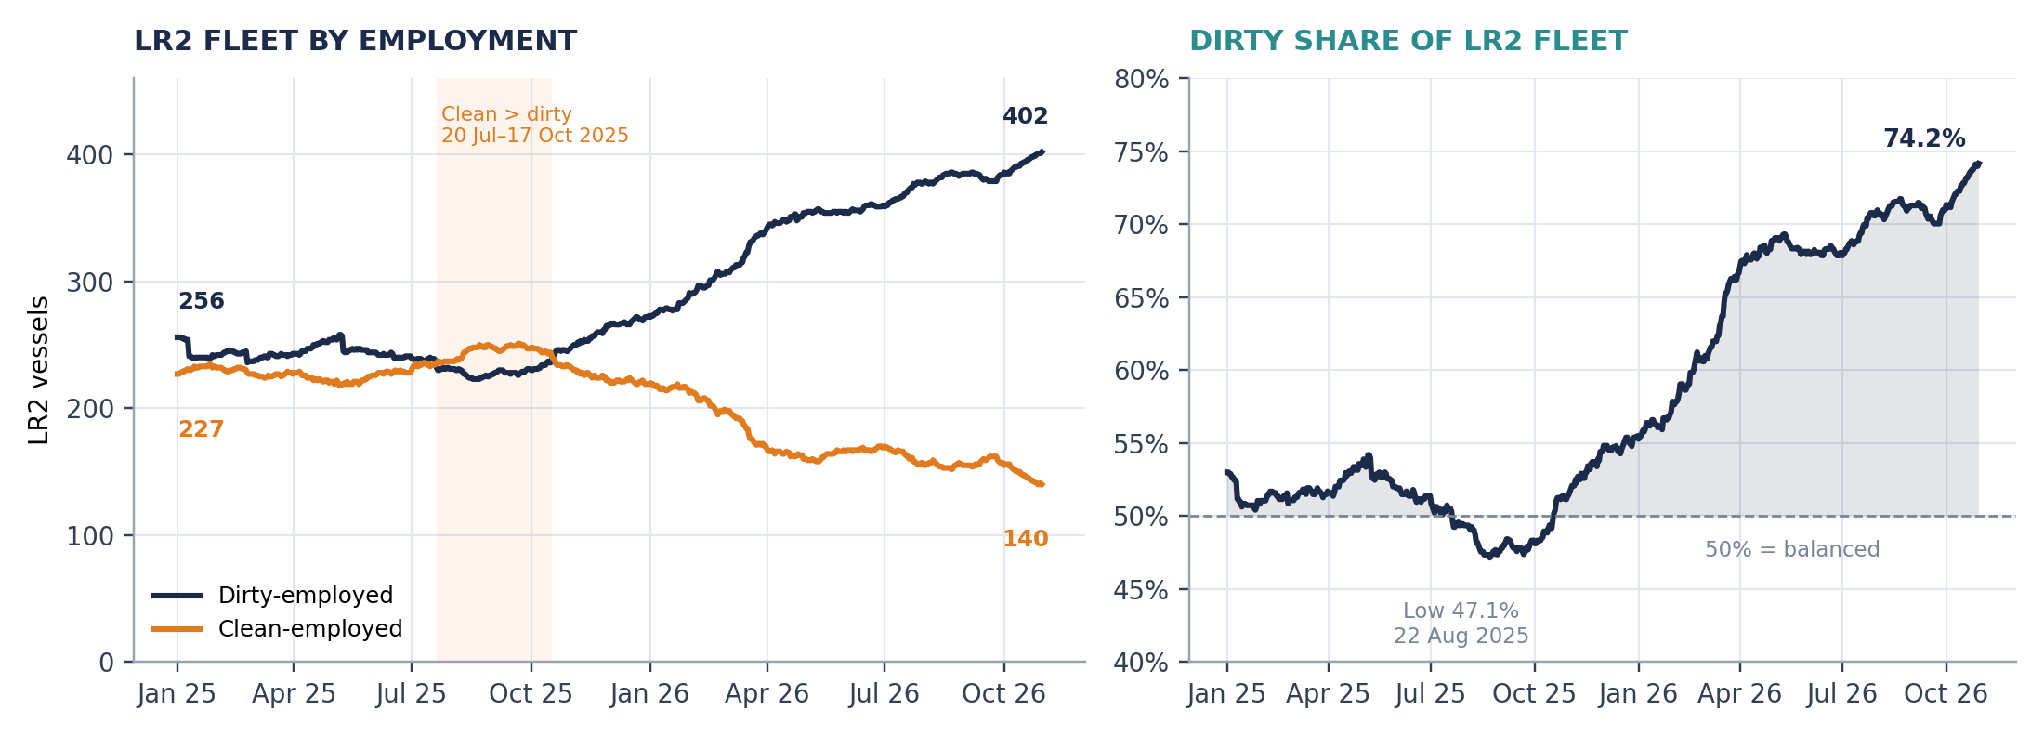
During the first half of 2025, LR2 employment remained relatively balanced between clean and dirty trades. Clean-employed vessels outnumbered dirty units between 20 July and 17 October 2025, with the dirty share falling to 47.1%on 22 August. However, the subsequent increase in dirty employment marked a notable change in fleet deployment, with more LR2 capacity shifting away from clean petroleum product trades.
The most significant adjustment occurred between January and April 2026, when dirty-employed LR2s increased by 82 vessels, compared with a reduction of 60 vessels in clean employment. This raised the dirty share from 55.3% to 68.9% in just four months. Since 23 July, the share has remained above 70%, suggesting a more persistent redistribution of LR2 capacity towards dirty trades rather than a short-lived change in employment patterns.
Deployment: Relet and Spot Drive the Dirty Build
The breakdown by employment type provides further insight into the redistribution of LR2 capacity. Within dirty trades, relet employment recorded the largest increase, rising from 43 to 125 vessels, followed by gains in spot (+46) and programme employment (+32). In contrast, the clean segment experienced its largest reduction in spot employment, where vessel numbers declined from 113 to 64.
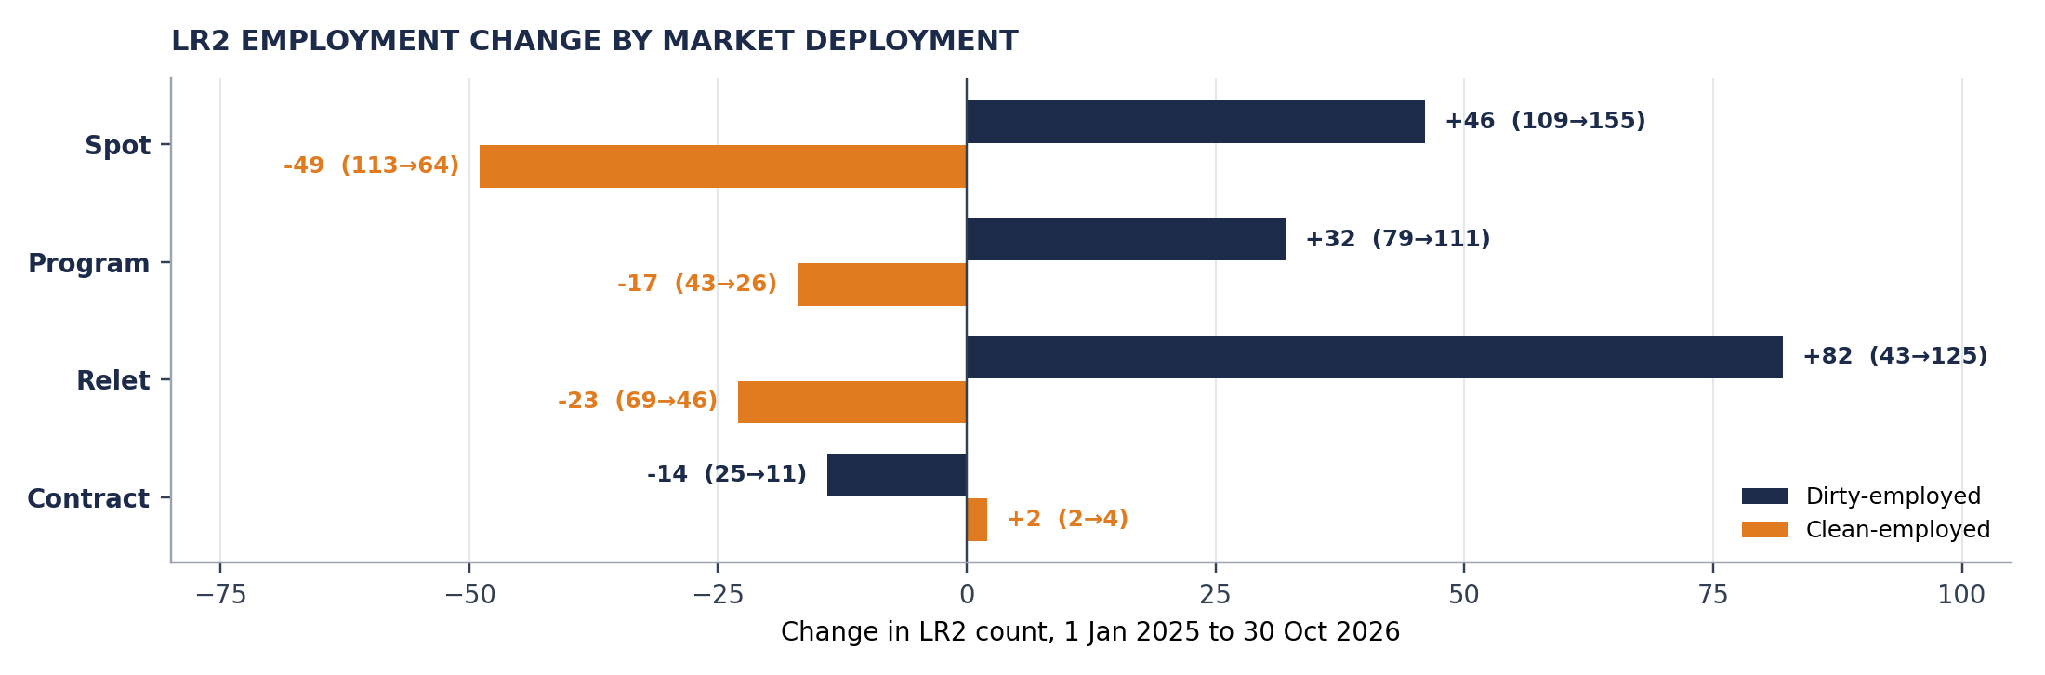
In our interpretation, the near-tripling of dirty relet tonnage points to a meaningful part of the shift taking place through relet arrangements rather than purely through spot fixing. The employment data record deployment type only; they do not show the underlying contractual or pooling arrangements. For clean product markets, the contraction of the spot list matters most, as prompt spot tonnage is most directly exposed to daily freight.
LR2 Employment Shifts Accelerate in 2026
Weekly LR2 employment figures show a sustained reduction in clean-employed tonnage since October 2025, with the decline accelerating during 2026. The clean-employed fleet fell by a net 6 vessels in 2025, compared with a much larger decline of 82 vessels in the first ten months of 2026. The largest weekly reduction occurred in the week ending 20 March 2026, when clean employment fell by 14 vessels, while dirty trades rose by 16 vessels.
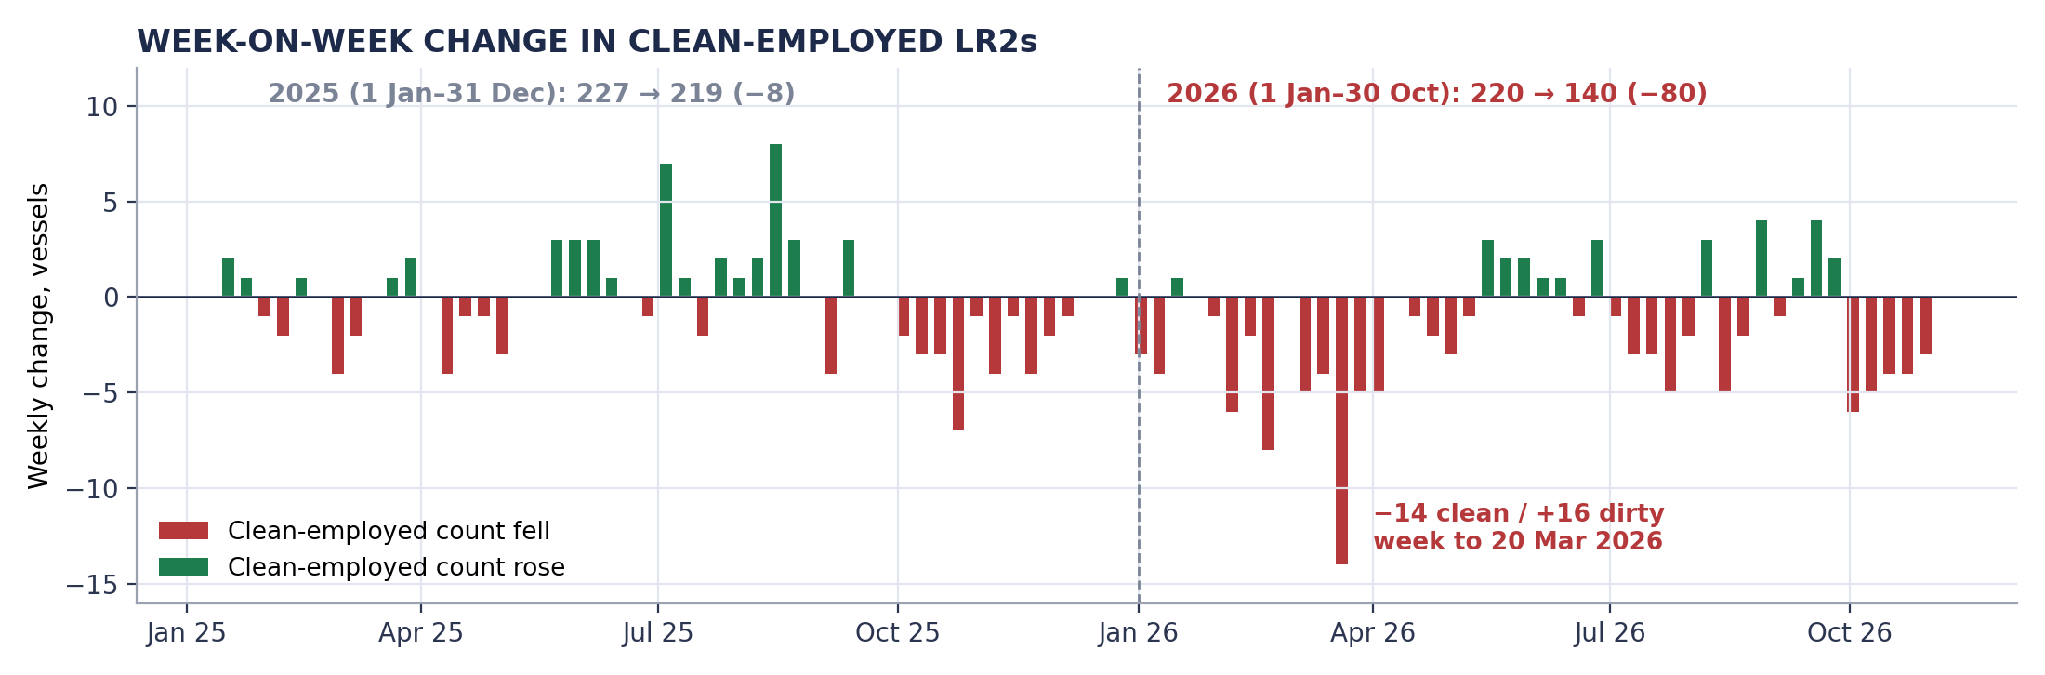
The reduction continued into October, with five consecutive weekly declines ranging from 3 to 6 vessels. Although clean employment recorded occasional weekly increases, these were insufficient to offset the loss of tonnage. The contraction in clean-employed LR2 capacity, alongside growing dirty employment, has reduced the fleet available for clean petroleum product trades, with potential implications for vessel supply and freight conditions. Weekly changes in employment counts do not necessarily reflect direct shifts between clean and dirty trades, as fleet additions, removals and classification changes may also influence the figures.
The Aframax Connection
The combined Aframax/LR2 population offers a wider view of the supply balance. Dirty-employed vessels in this dataset population rose from 676 on 1 January 2026 to 800 on 30 October 2026, while clean-employed vessels declined from 233 to 149. The population’s dirty share reached 84.3%.
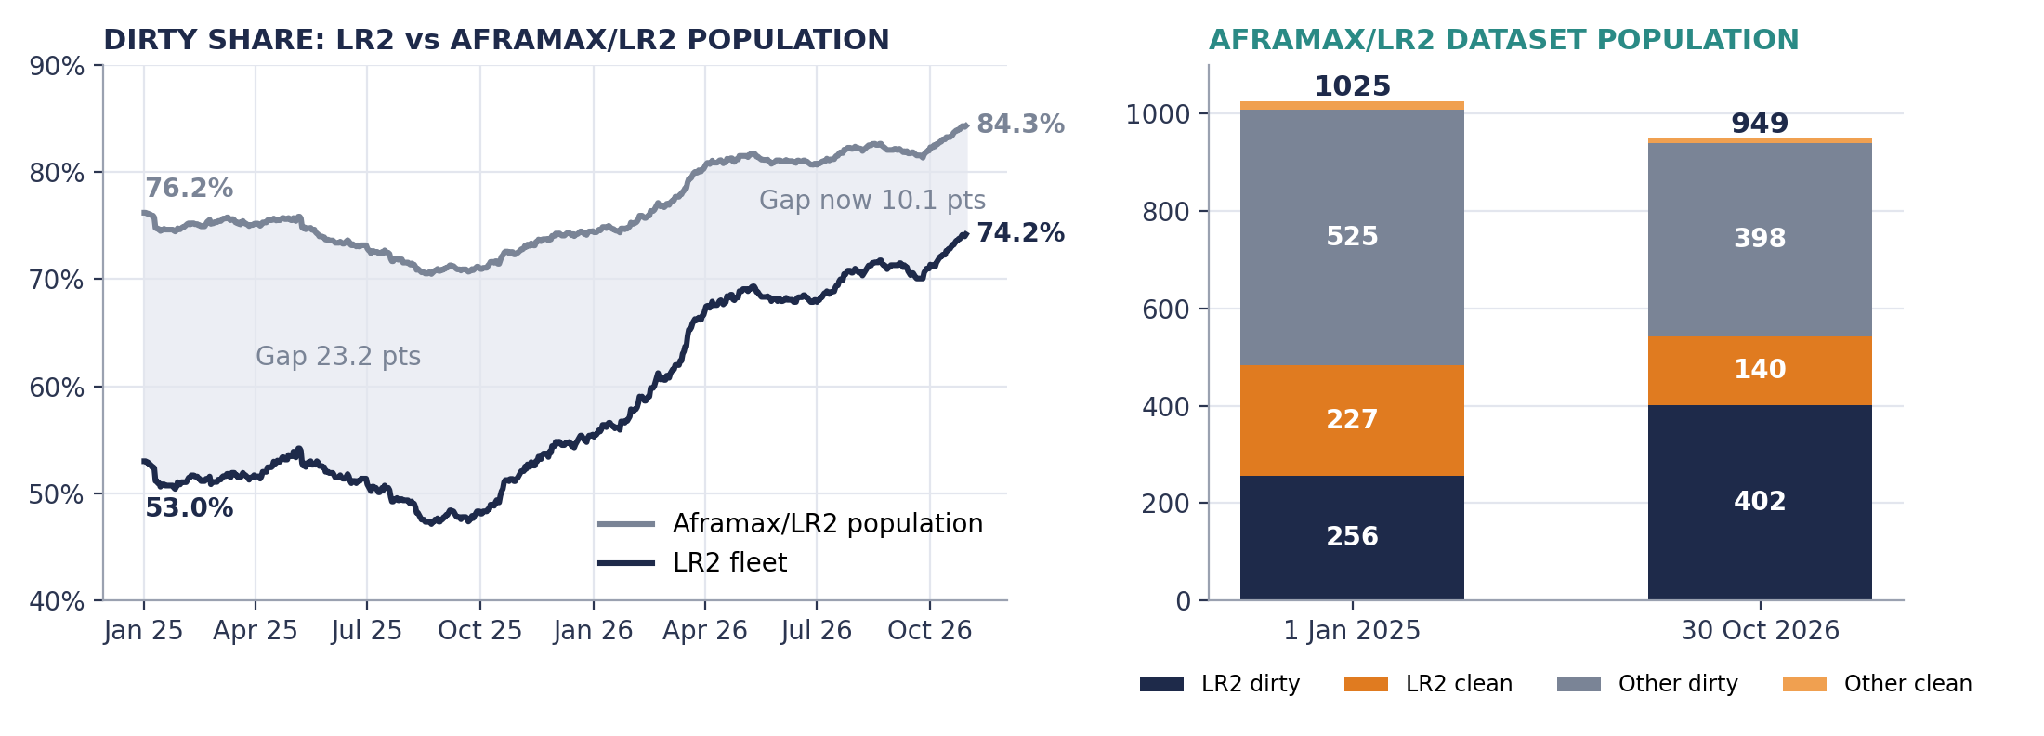
The LR2 fleet is converging on the dirty profile of the wider Aframax/LR2 population: the gap between the two shares has narrowed from 23.2 to 10.1percentage points. LR2s now account for 57% of the population, compared with 47% at the start of 2025, while vessels outside the LR2 count fell from 542 to 407. Only 9 clean ships remain outside the LR2 count, so clean Aframax-size availability is now almost entirely an LR2 question.
Freight Implications: Fleet Growth Does Not Equal Available Supply
For clean product markets, a smaller actively employed LR2 fleet may increase sensitivity to cargo demand, vessel positioning and regional imbalances. Even as the overall fleet grows, fewer vessels in clean trades can limit the market’s capacity to absorb additional product cargoes, particularly on long-haul routes.
For dirty markets, increasing LR2 participation expands the supply of tonnage competing for crude and dirty petroleum product cargoes. The freight effect will depend on geographical deployment, cargo sizes, voyage duration and owners’ willingness to move vessels between markets.
The cost and operational requirements of returning a dirty-employed vessel to clean service also matter. Tank cleaning, cargo suitability and commercial considerations mean that capacity to return to clean trades is not immediately available, so any tightness in clean tonnage could persist for some time once established.
Market Takeaways
The most significant development is not simply that more LR2s are trading dirty, but that the relationship between nominal fleet growth and effective clean tanker supply has changed. With more than 70% of the LR2 fleet in dirty trades, future shifts in LR2 employment could matter for both product tanker availability and Aframax-class dirty competition.
Whether this pattern persists will depend on relative earnings, cargo demand and the commercial incentives for vessels to return to clean service. A sustained run of weekly gains in clean-employed LR2s would signal a potential reversal of the trend. For freight analysis, tracking LR2 employment between clean and dirty trades is becoming as important as monitoring the size of the fleet itself.
Source: Signal Ocean Platform, LR2 and Aframax/LR2 vessel employment data, 1 January 2025–7 November 2026. Calculations by Signal Ocean Market Insights.
Disclaimer: This report has been prepared by Signal Group for general information purposes only. It does not constitute, and should not be relied upon as, investment, financial, trading, legal or commercial advice, or as a recommendation to enter into any transaction. While reasonable efforts have been made to ensure the information is accurate and reliable at the date of publication, no representation or warranty, express or implied, is given as to its accuracy, completeness or continued availability. Certain figures may be estimates or provisional and may subsequently be revised. Market conditions and other external factors may change without notice and may not be reflected in this report. Readers should conduct their own assessment and seek appropriate professional advice before making any decision. To the fullest extent permitted by law, Signal Group accepts no liability for any loss or damage arising from the use of, or reliance on, this report.
Source: Signal Group.



Related News.

Cyprus Shipping Chamber announces inaugural Global Shipping Minds Summit
The Cyprus Shipping Chamber (CSC) is pleased to announce the inaugural Global Shipping Minds Summit, which will take place on 27 November 2026 at…

ICS Chair warns rising geopolitical risks threaten global trade and freedom of navigation at Hong Kong Global Maritime Trade Summit
The third Hong Kong Global Maritime Trade Summit brought together senior government representatives and maritime industry leaders to discuss the…

InterManager welcomes two new members to its growing international network
InterManager the international trade association for the ship management sector, has welcomed Alpha Navigation and Maryam Shipmanagement as its…

Statement of the President of the Union of Greek Shipowners UGS, Melina Travlos, ahead of the next round of negotiations on maritime decarbonisation at the International Maritime Organization IMO London, 23 Nov – 4 Dec 2026
Two months after the inconclusive last round of negotiations at the IMO on reducing greenhouse gas emissions from international shipping, and with…
EU Emission Trading System applying to offshore vessels from 1 January 2027
Since 1 January 2024, the EU Emission Trading System (ETS) has applied to shipborne carbon dioxide (CO₂) emissions of cargo or passenger ships of…

Giosuè Vezzuto appointed CEO of RINA Services to lead Maritime and Certification businesses
Giosuè Vezzuto has been appointed Chief Executive Officer of RINA Services, the RINA Group company active in marine and certification services. He…
San Pedro Bay Ports mark 20th Anniversary of Clean Air Action Plan with Meeting Aboard Zero-Emission Vessel
The Port of Los Angeles and Port of Long Beach will commemorate the 20th anniversary of the landmark Clean Air Action Plan (CAAP) with a special…

BW LPG announces sale of BW Mistral
BW LPG announced the sale of the 2015-built BW Mistral, acquired in the 2024 Avance Gas transaction. The sale of BW Mistral is expected to generate…

How ready are the world’s ports for maritime’s fuel transition
As shipping's energy transition accelerates, ports are becoming one of the most important enablers of decarbonisation. Shipowners are investing in…

NYK finalises outline and exterior design for new headquarters building
NYK has finalized the outline and exterior design of its new headquarters – a building planned to replace the existing Yusen Building in Marunouchi,…
Subscribe to our newsletter!
if you dont want to swim alone in the ocean of news, sign up for the newsletter, and you will receive daily all the important news of world shipping!
