Brazil Premium Rebuilds: C3–C5 Spread Back Above $21/mt


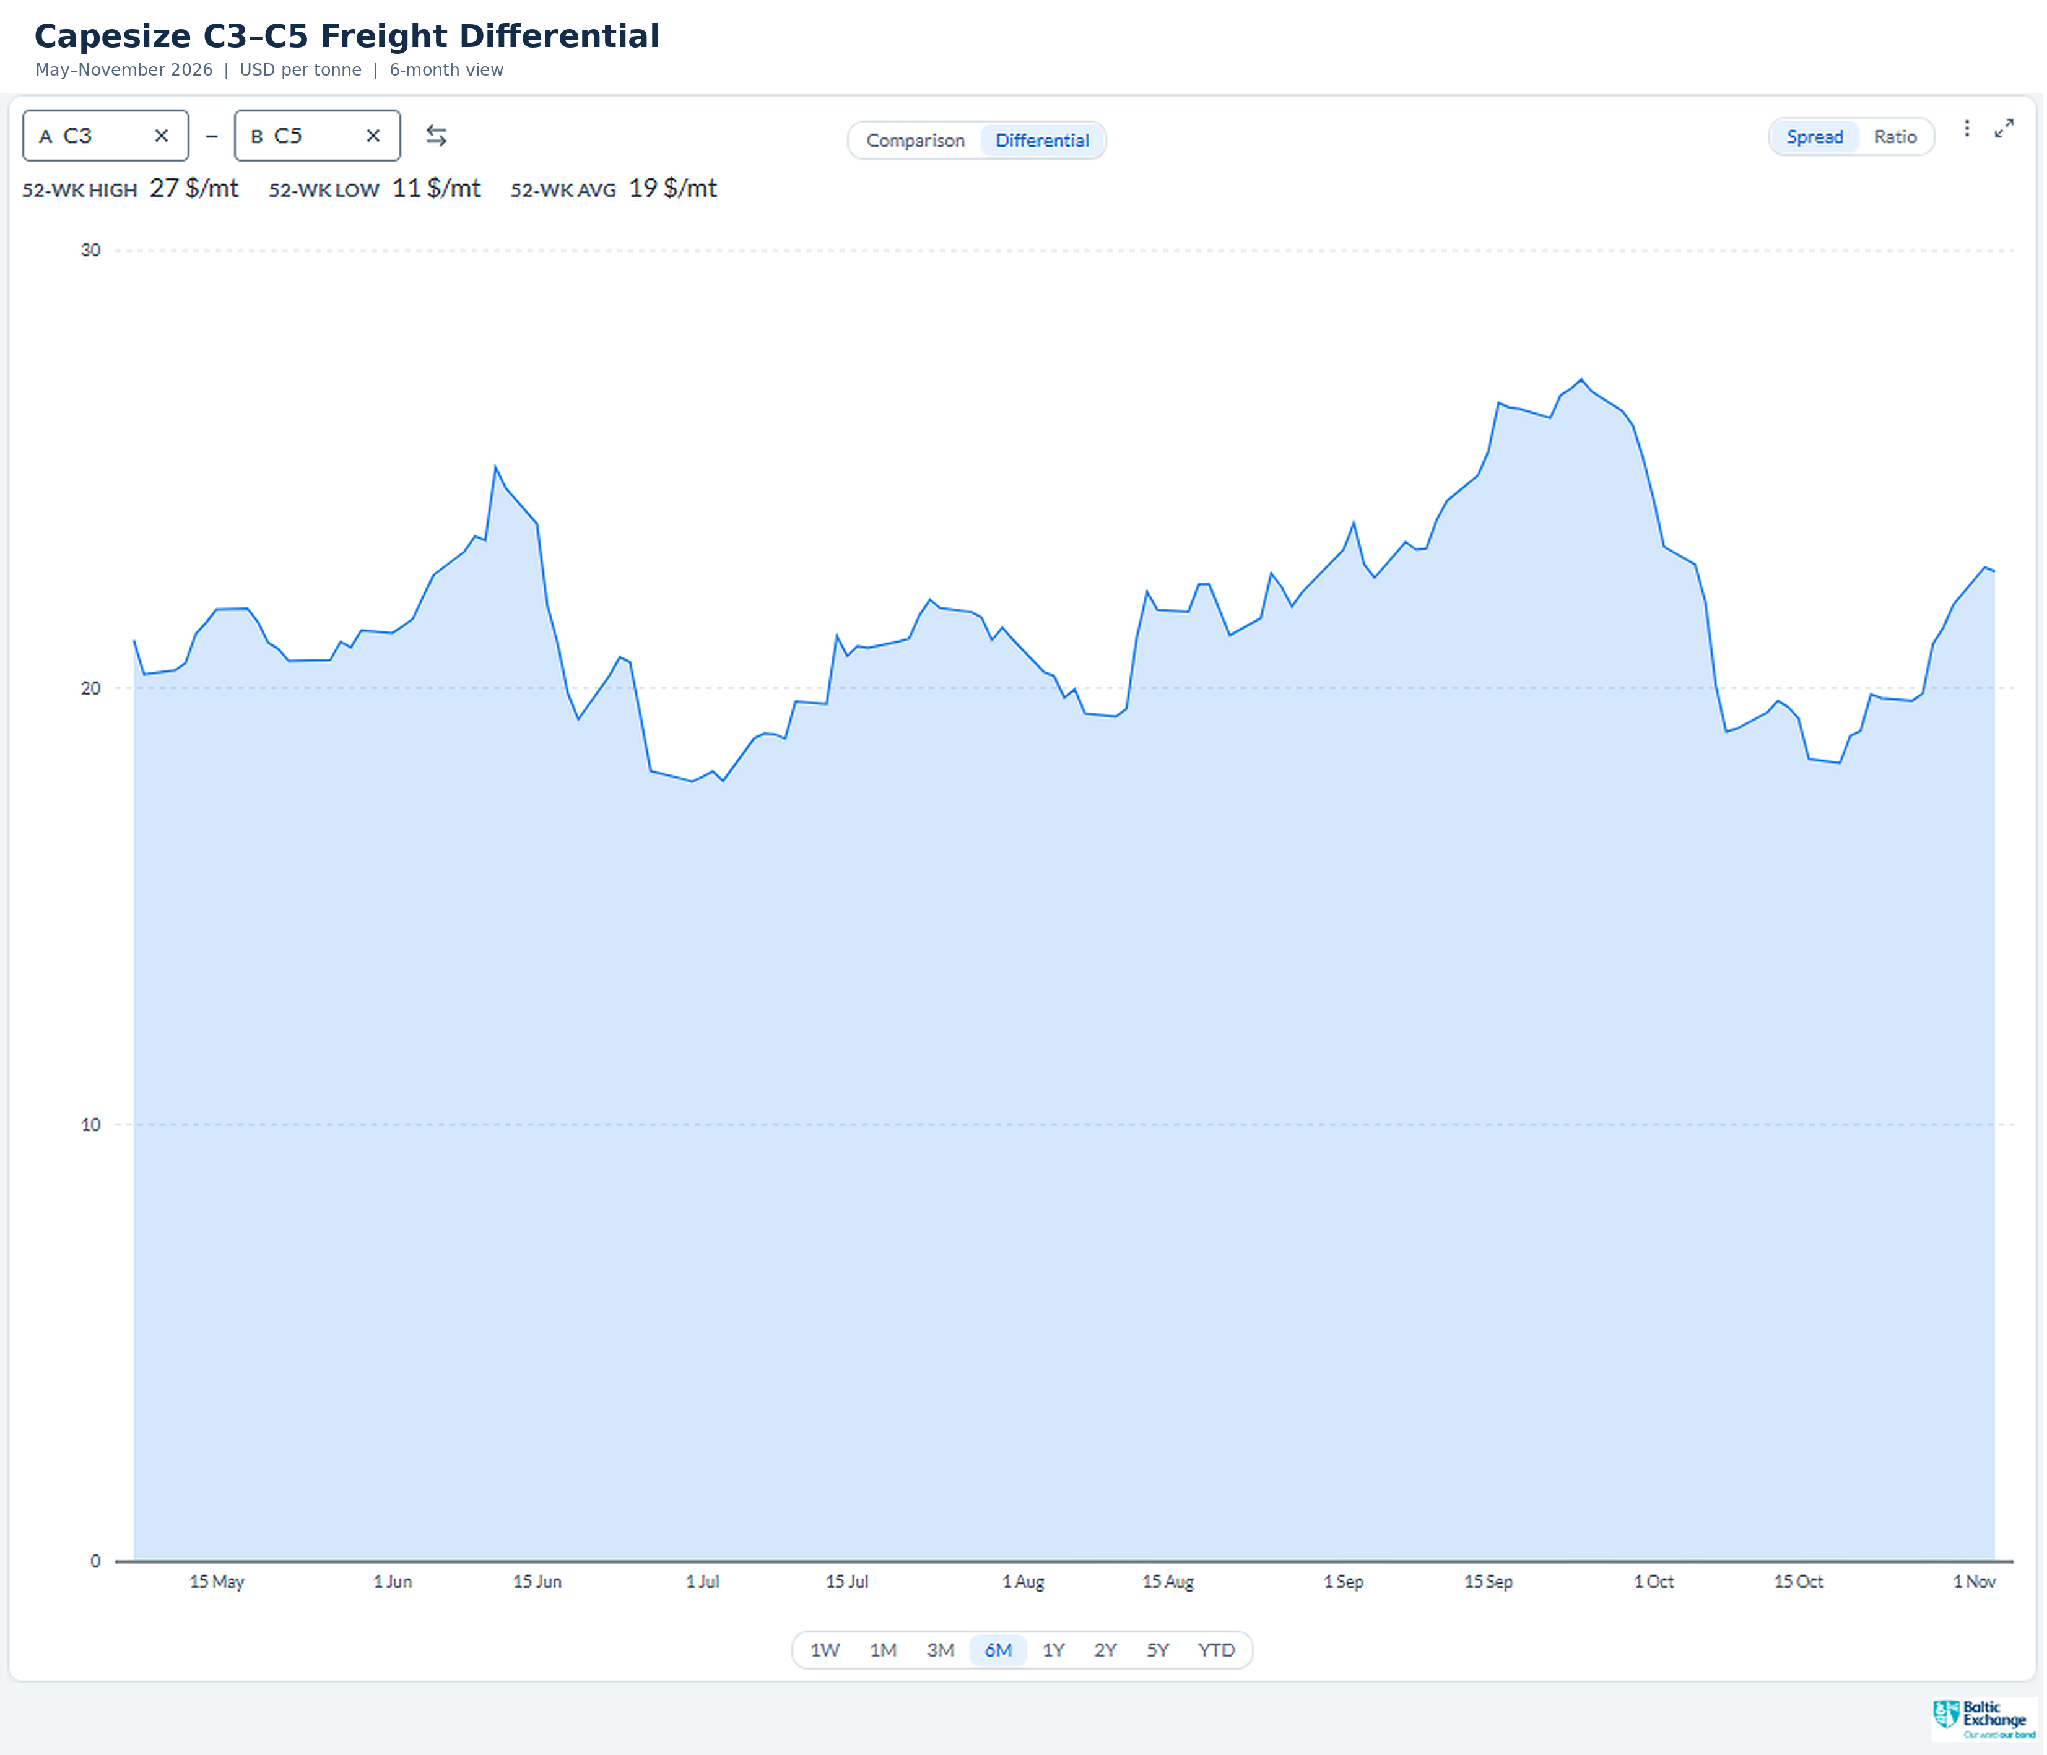
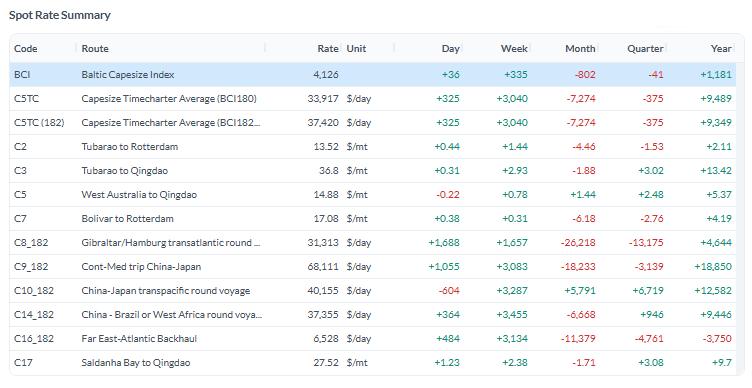
Brazil–China freight pulled away from West Australia–China for a second week. C3 Tubarao–Qingdao rose by $2.93/mt to $36.80/mt; C5 West Australia–Qingdao rose by only $0.78/mt to $14.88/mt. At the 30 October close, the spread was $21.92/mt, up $2.15/mt from $19.77/mt a week earlier and above its 52-week reference average of $19/mt. It had fallen from about $27/mt in late September to about $18/mt in mid-October. A later reading, on 2 November, put it near $22.7/mt.
SUPPLY & DEMAND | Weekly Volatility
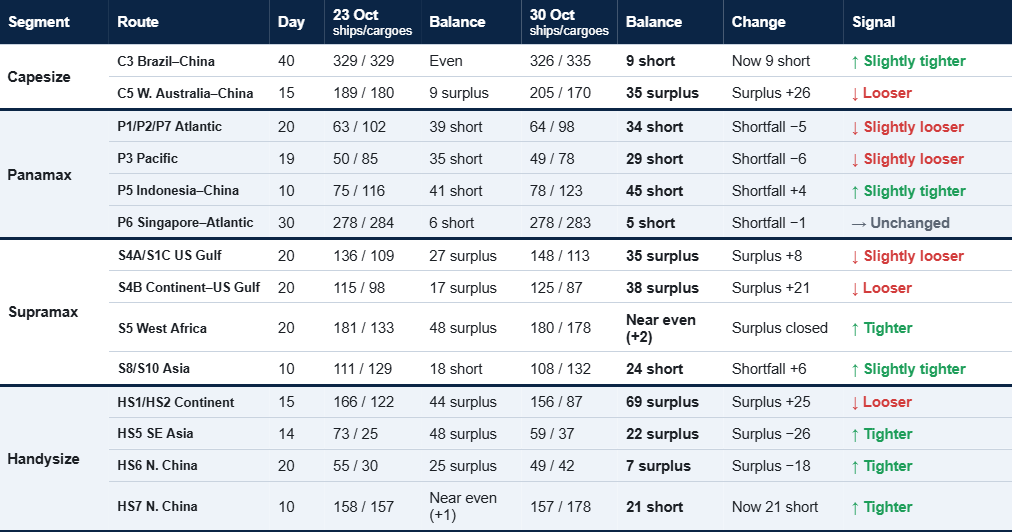
In the Capesize market, C3 Brazil–China tightened slightly as available ship counts fell below expected cargoes to around day 36, while C5 West Australia–China moved into surplus as vessel supply expanded to 205 against 170 cargoes by day 15. Panamax forward counts showed little net change overall; however, P1/P2/P7 Atlantic and P3 Pacific experienced slight loosening, whereas P5 Indonesia–China tightened slightly and P6 Singapore–Atlantic remained unchanged. Across geared vessel segments, US Gulf Supramax routes (S4A/S1C and S4B) and Continent Handysize (HS1/HS2) loosened further, with vessel surpluses widening. Conversely, Supramax S5 West Africa, S8/S10 Asia, and Handysize routes HS5 SE Asia, HS6 North China, and HS7 North China all tightened, with HS7 swinging from near-even balance into a 21-ship shortfall.
Demand vs supply ratio. A slower, fleet-wide measure. Each index compares the current four-week mean with the same four weeks a year earlier (×100).

FREIGHT MARKET OVERVIEW
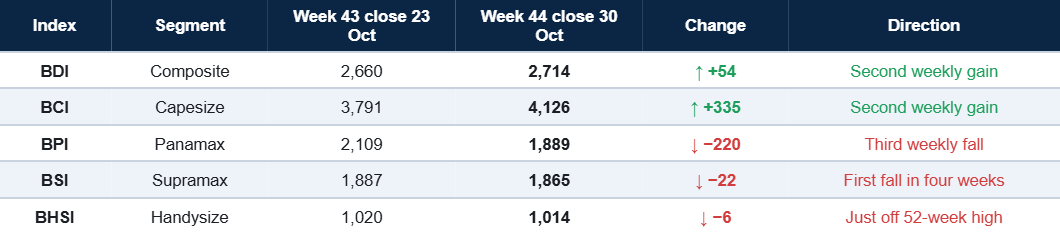
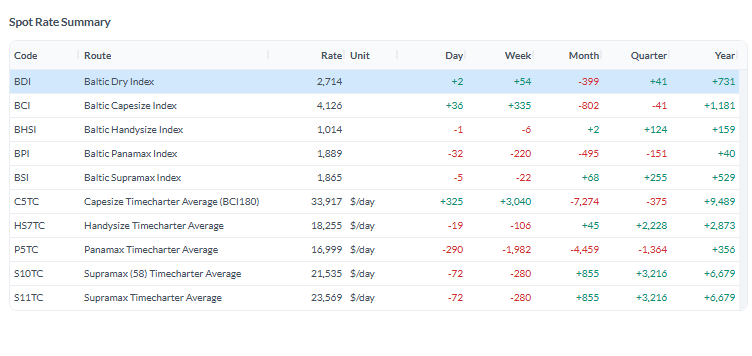
From Week 43 to Week 44. Capesize led the market: the BCI rose 335 points to 4,126, and C5TC(180) rose $3,040/day to $33,917/day, with every route higher. Panamax went the other way: the BPI fell 220 points to 1,889, and P5TC fell by $1,982/day to $16,999/day, with every route lower. The BDI closed October at 2,714, down 399 points on the month and up 731 on the year.
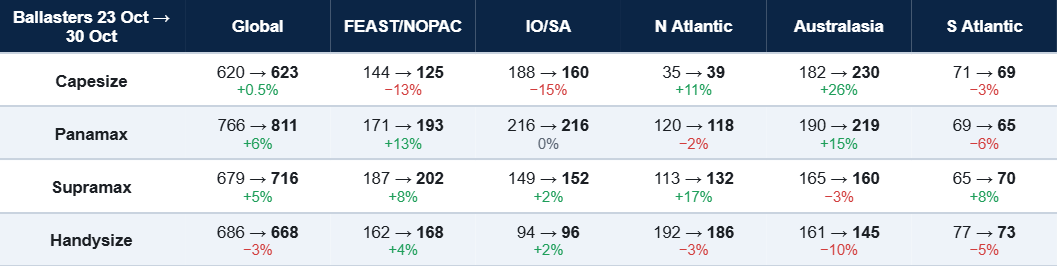
Geared sizes pause near the top. The BSI fell 22 points to 1,865, 25 below its 52-week high; the BHSI fell 6 points to 1,014, 6 below its own. Against the Week 43 readings, Supramax ballasters rose 5%, and Handysize ballasters fell 3%.
KEY TAKEAWAY
- Capesize: C3 ships stay below cargoes to about day 36 (day 20 a week earlier), while C5 ships now cover cargoes throughout; Australasia ballasters rose 26% to 230. The C3–C5 spread closed at $21.92/mt, above its 52-week average.
- Panamax: third weekly fall, every route lower. Forward route counts moved little, but the D/S ratio fell to 0.91 from 0.98, and global ballasters rose 6% to 811.
- Supramax and Handysize: near 52-week highs. US Gulf and Continent surpluses widened and are the main drag for the next fixing window; Asian shortfalls (S8/S10, HS7) are the support.
CAPESIZE
Freight. The BCI rose 335 points to 4,126, and C5TC(180) rose by $3,040/day to $33,917/day (C5TC(182) $37,420/day). Every route gained: C14_182 +$3,455/day to $37,355/day, C10_182 +$3,287/day to $40,155/day, C3 +$2.93/mt to $36.80/mt, and C5 +$0.78/mt to $14.88/mt. C9_182 remains the top route at $68,111/day.
Cargo backdrop. Iron ore hit a two-year low: SGX touched $89.25/t on 27 October. China’s October manufacturing PMI dropped to 49.3 from 50.1, back in contraction. Weaker steel demand is the risk to Q4 ore buying; so far Capesize rates have moved the other way.
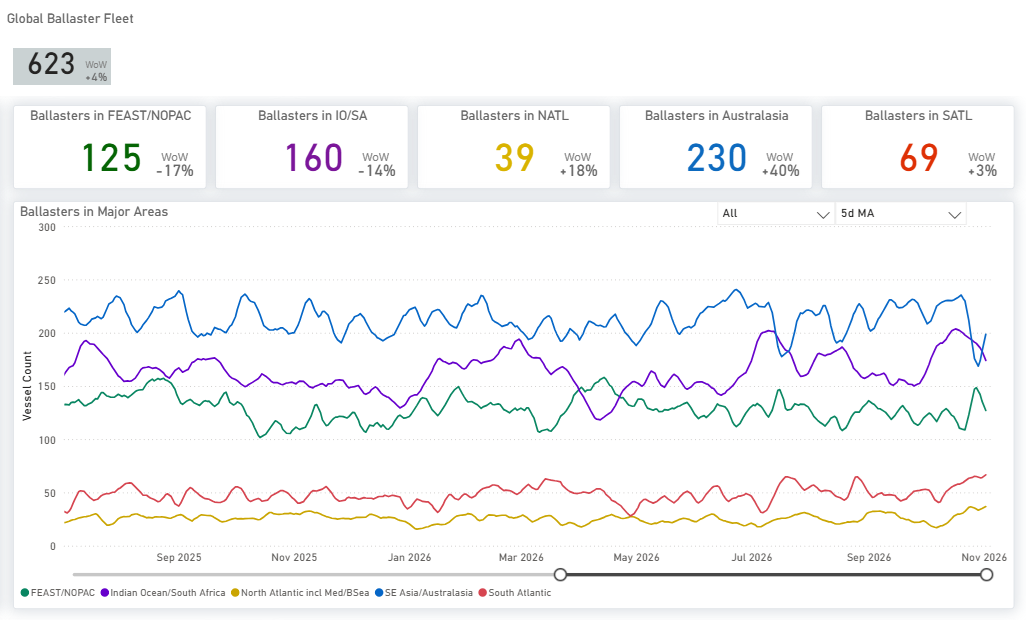
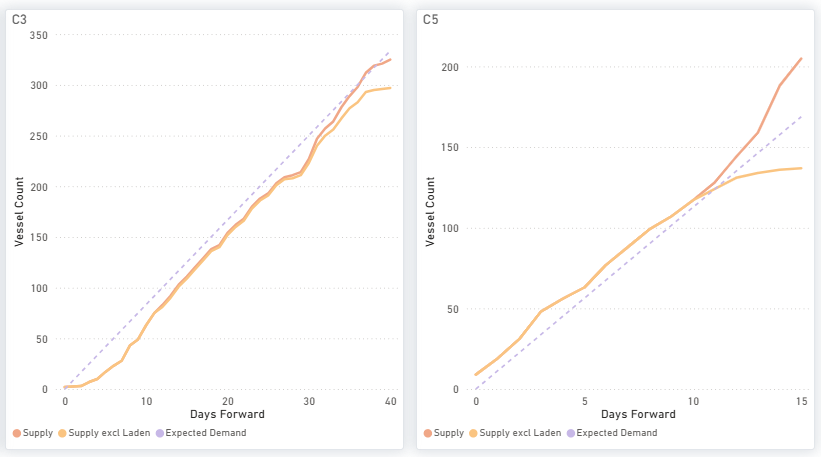
Ships vs cargoes. C3: ships below cargoes to about day 36 (326 vs 335 by day 40). C5: ships at or above cargoes throughout (205 vs 170 by day 15). Ballasters vs Week 43: Australasia 182→230 (+26%); FEAST/NOPAC 144→125 (−13%); IO/SA 188→160 (−15%).
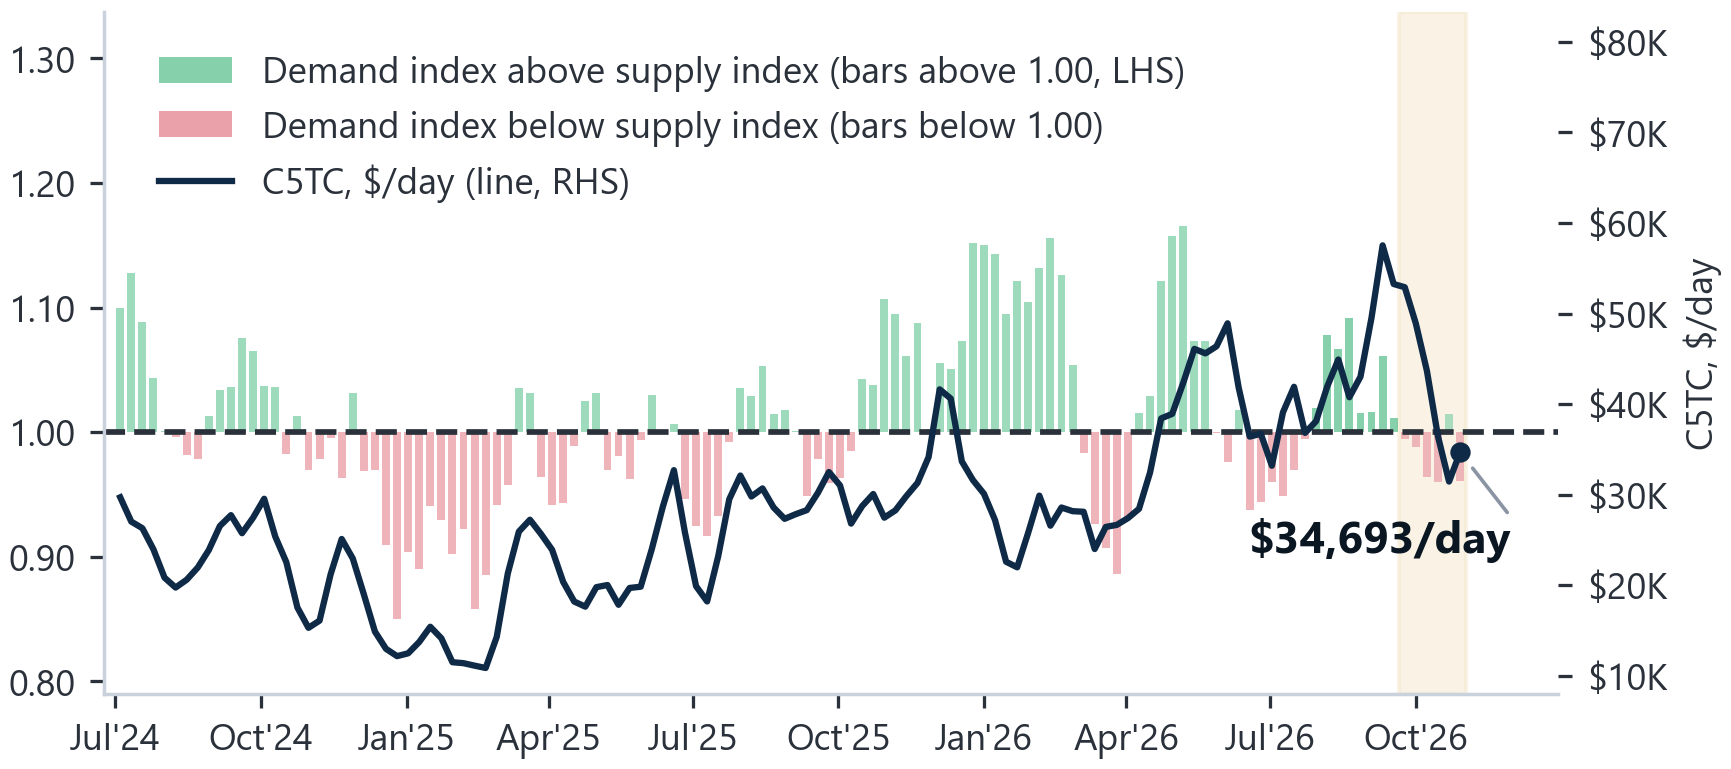
Demand vs. supply. D/S ratio 0.96: demand index 101.1, supply index 105.2. The rate gain came with the ratio below 1.00, consistent with a positioning-led move rather than fleet-wide tightness.
PANAMAX
Freight. The BPI fell 220 points to 1,889, and P5TC fell by $1,982/day to $16,999/day, a third weekly fall, with every route lower. The Atlantic led: P2A_82 −$3,678/day to $22,842/day (still the top route) and P1A_82 −$3,504/day to $14,232/day. P5_82 fell by $2,411/day to $18,361/day and P7 by $3.58/mt to $68.36/mt.
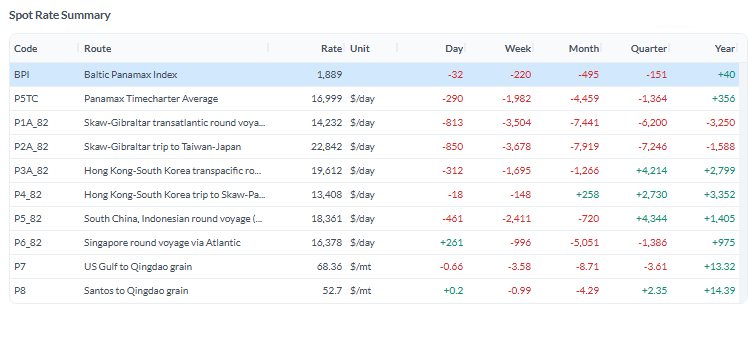
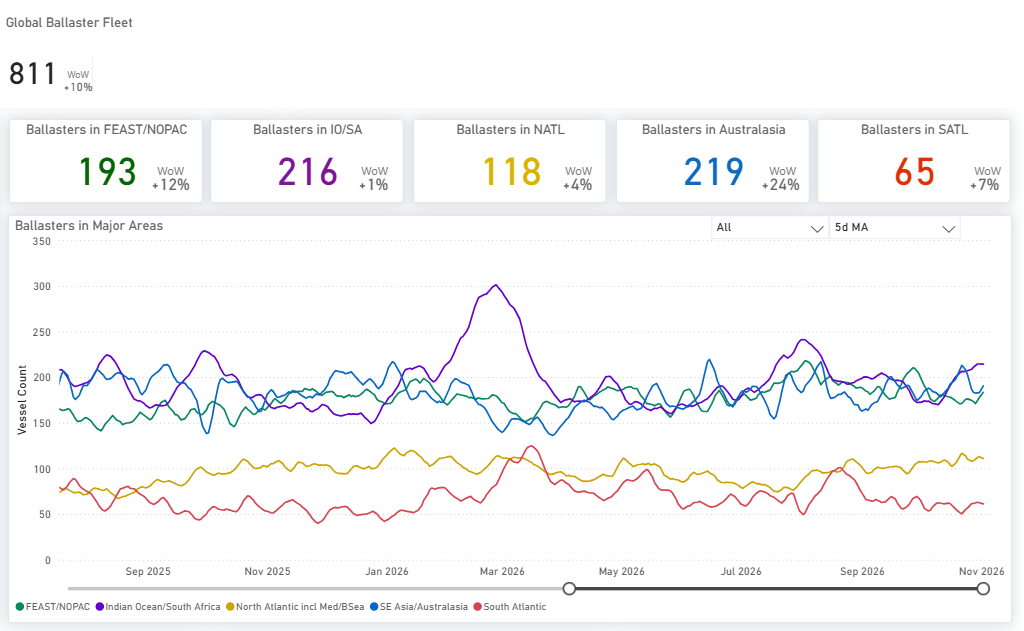
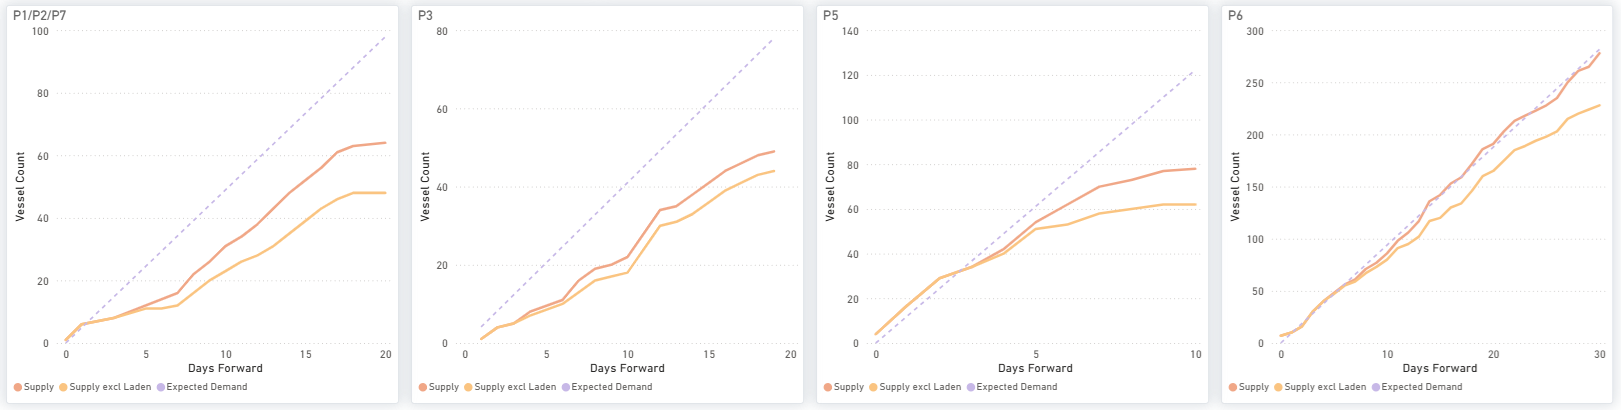
Ships vs cargoes. Little net change. P1/P2/P7 64 vs 98 by day 20 (shortfall 5 smaller); P3 49 vs 78 by day 19 (6 smaller); P5 78 vs 123 by day 10 (4 larger); P6 278 vs 283 by day 30 (unchanged). Ballasters vs Week 43: global 766→811 (+6%); Australasia 190→219 (+15%); FEAST/NOPAC 171→193 (+13%).
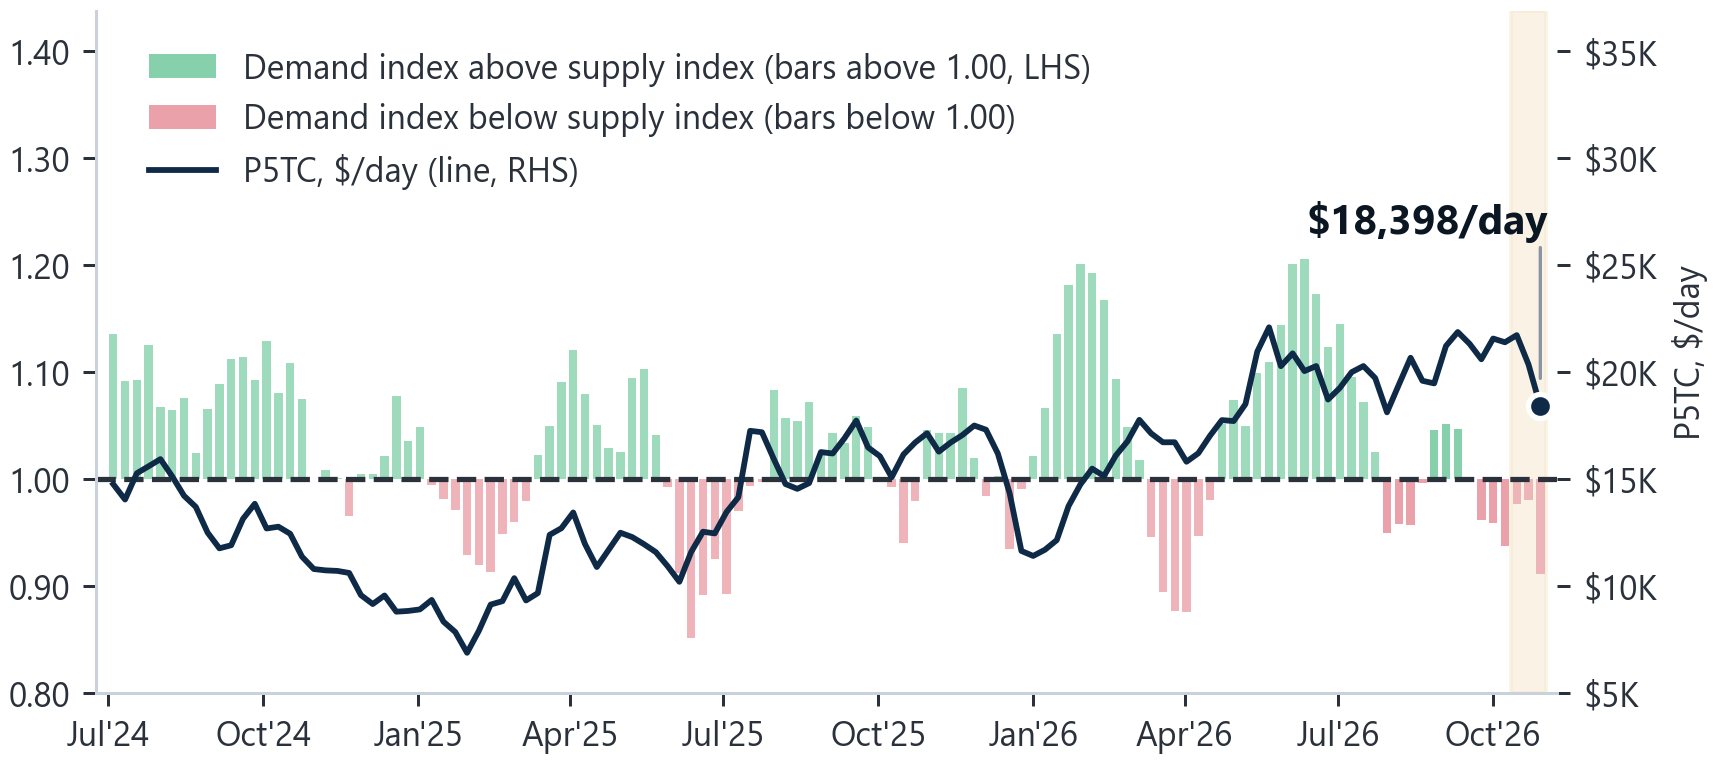
Demand vs supply. D/S ratio 0.91, from 0.98: demand index 91.0, supply index broadly unchanged. Route counts cover the next 10–30 days on specific routes; the ratio covers four weeks of fleet-wide tonne-miles against a year earlier, so the two can diverge.
SUPRAMAX
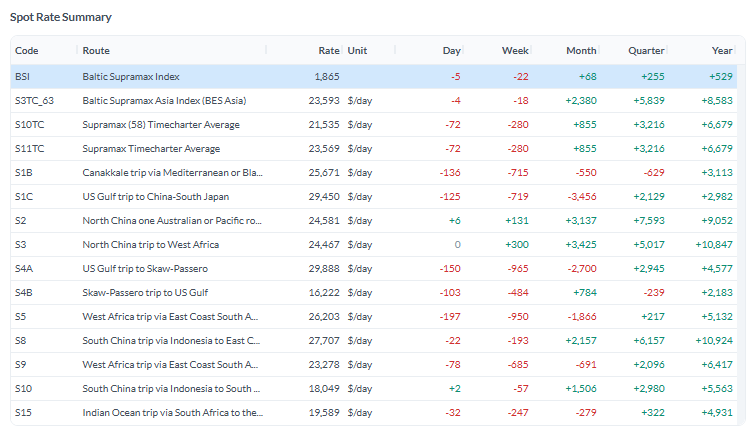
Freight. The BSI fell 22 points to 1,865, ending three weeks of gains 25 points below its 52-week high, and S11TC fell by $280/day to $23,569/day. The Atlantic led the fall: S4A −$965/day to $29,888/day, S5 −$950/day, and S1C −$719/day to $29,450/day. Asia held up: S3 +$300/day to $24,467/day and S2 +$131/day.
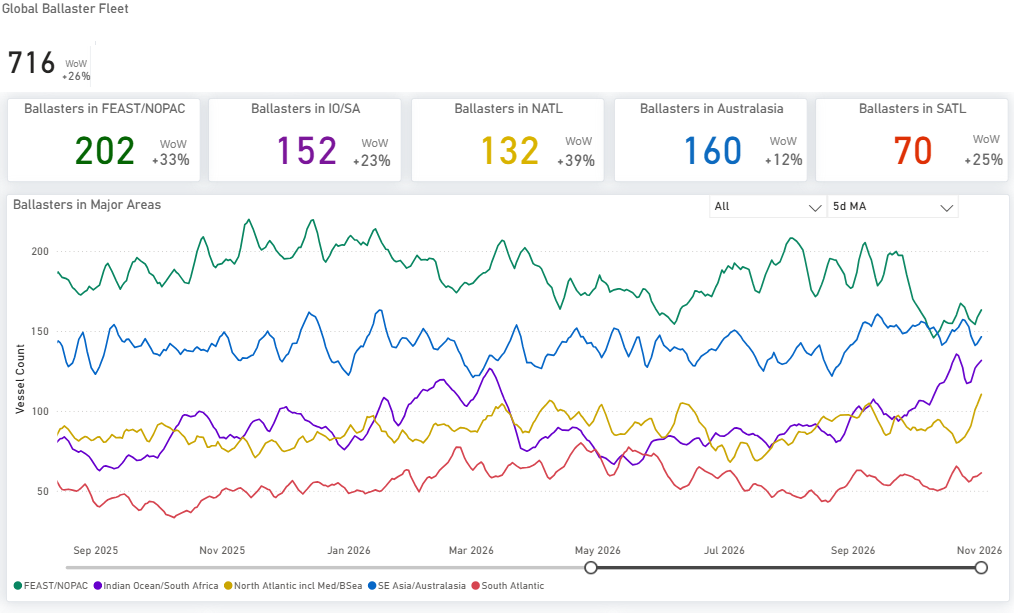
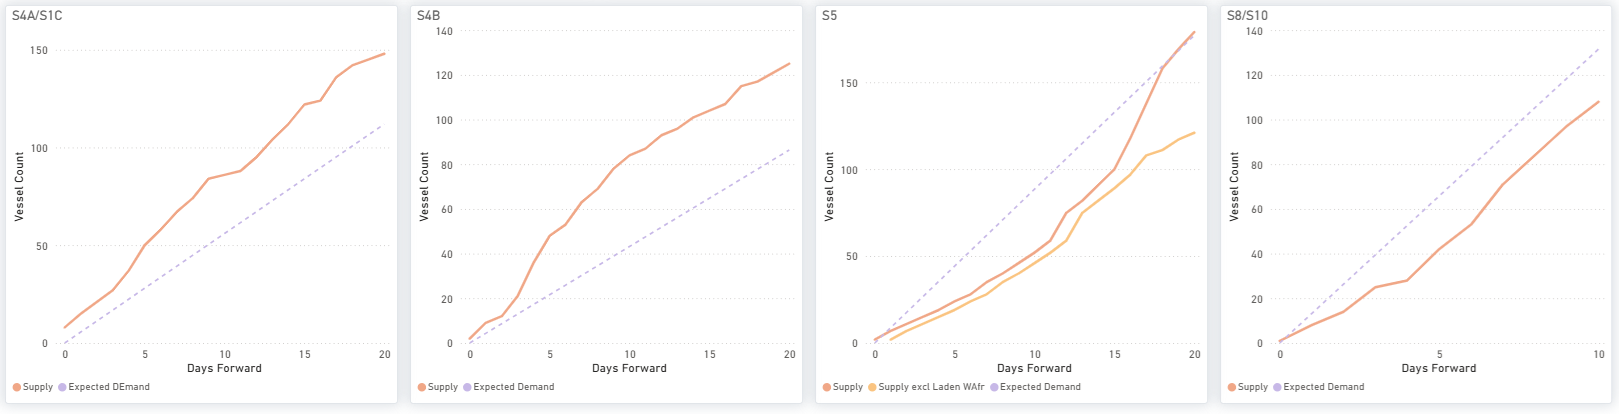
Next fixing window. The US Gulf surplus is the main drag and widened: 148 ships vs 113 cargoes on S4A/S1C and 125 vs 87 on S4B by day 20. Asia is the support: S8/S10 108 vs 132 by day 10. S5 West Africa tightened to near balance (180 vs 178 by day 20, from 181 vs 133). Ballasters vs Week 43: global 679→716 (+5%); North Atlantic 113→132 (+17%).
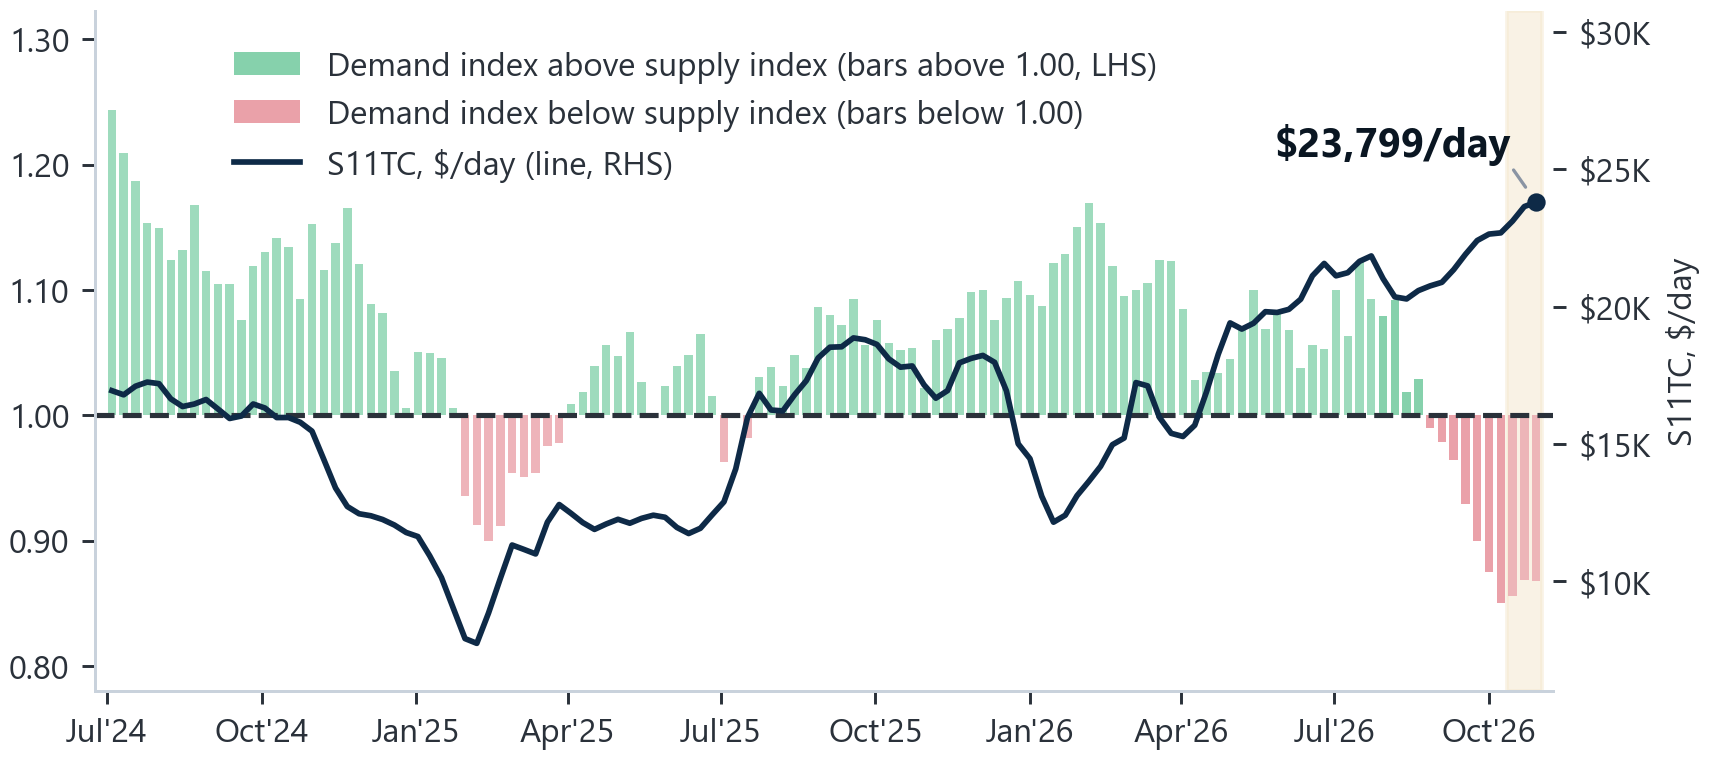
Demand vs. supply. D/S ratio 0.87, the lowest of the four: demand index 88.2, supply index 101.6. The BSI near its 52-week high reflects a few strong routes, not a broad demand recovery.
HANDYSIZE
Freight. The BHSI fell 6 points to 1,014, 6 below its 52-week high, and HS7TC fell by $106/day to $18,255/day. HS4_38 (US Gulf) fell by $1,100/day to $18,557/day. Asia firmed: HS7_38 +$237/day to $18,675/day, HS6_38 +$106/day, and HS5_38 +$63/day. HS3_38 (South Atlantic) remains the top route at $29,933/day.
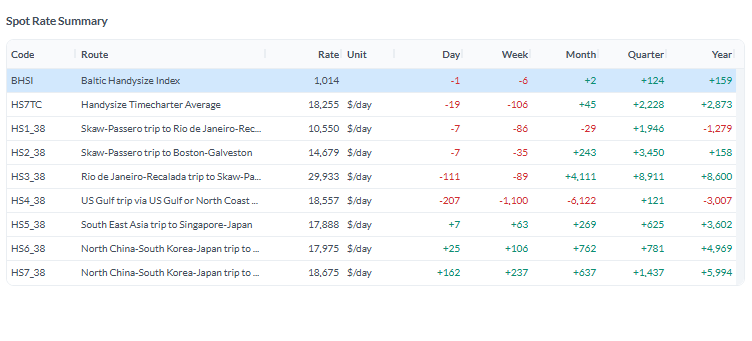
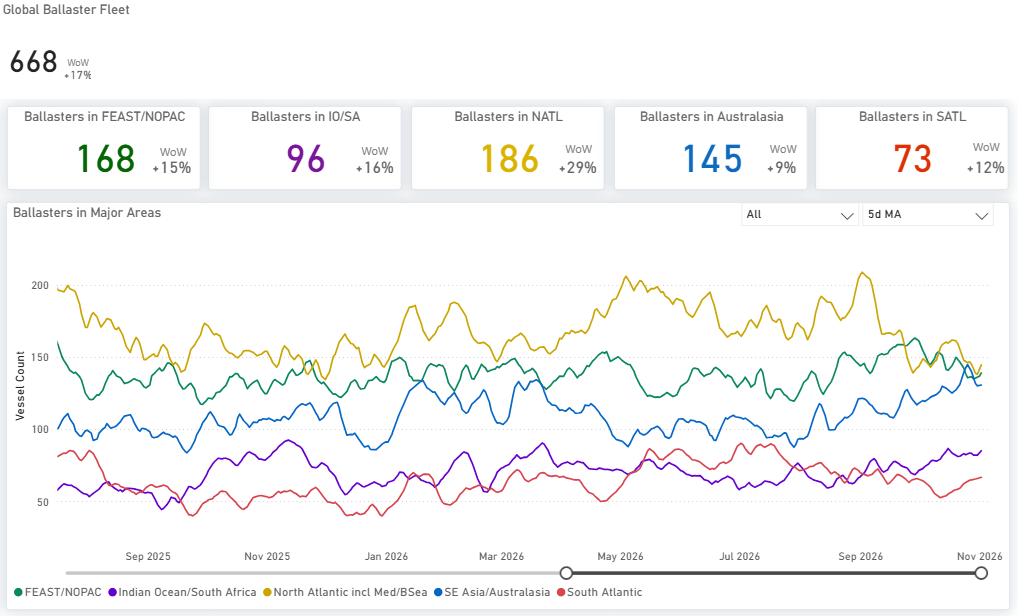
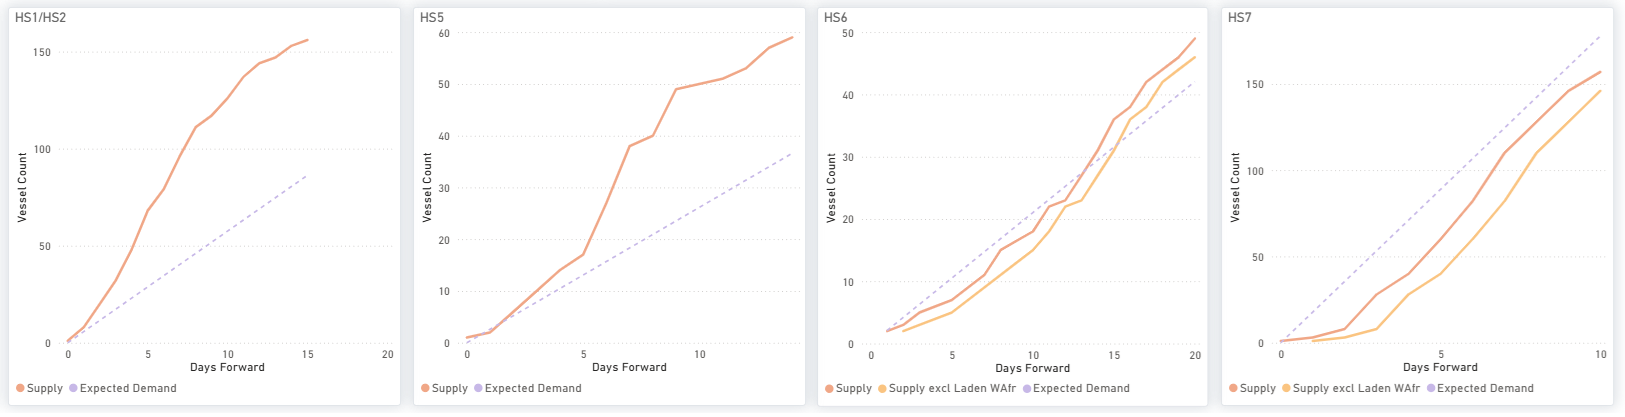
Next fixing window. HS7 is the nearest-dated support: 157 ships vs 178 cargoes by day 10, from a balance a week earlier. HS1/HS2 is the main drag: 156 vs 87 by day 15. The HS5 surplus narrowed (59 vs 37 by day 14, from 73 vs 25) and HS6 is near balance (49 vs 42 by day 20). Ballasters vs Week 43: global 686→668 (−3%); Australasia 161→145 (−10%).
Source:Signal Ocean



Related News.

RINA’s Hellenic Technical Committee puts energy-efficient newbuilding design and AI in focus
Project Mermaid, battery integration and practical AI applications highlight opportunities for more efficient ship design and fleet operations…

From mine to market – NORDEN connects Comilog’s manganese ore with global markets
NORDEN’s dedicated transhipment operation in Gabon, run under a long term contract with long-standing customer Comilog, has loaded more than 54…
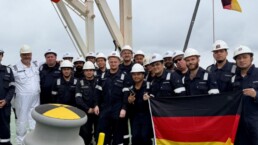
Oldendorff reflags two capesize vessels to Germany
Oldendorff Carriers is reflagging two of its Capesize bulk carriers to Germany, underlining the company’s long standing ties to the country and its…

AskChief surpasses 100-vessel milestone in under a year and opens its specialised maritime AI to the wider market
Putting each company’s own knowledge to work for maritime Technical and HSQE teams. AskChief, Specialised AI for maritime Technical and HSQE…

Dalian Maritime University’s Yu Jiajia receive 2027 IMO Gender Equality Award
From the bridge to the classroom, Ms Yu has helped build a more inclusive maritime sector in China, serving as a role model for the global maritime…
“K” LINE releases video update on forecasts for FY2026 and progress of the medium-term management plan
Kawasaki Kisen Kaisha, has released a video on its official website explaining its forecasts for FY2026 and progress of its Medium-Term Management…

MOL and MOL CAREER sign 3-way deal with Nagasaki Prefecture to promote recruitment and retention of foreign workers
Mitsui O.S.K. Lines, and MOL CAREER, have entered into a tripartite partnership agreement with Nagasaki Prefecture to promote the revitalization of…
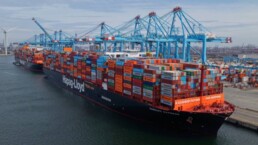
Hapag-Lloyd completes acquisition of 25% stake in APM Terminals Maasvlakte II
Transaction successfully completed following antitrust approval Investment strengthens Hapag-Lloyd’s terminal portfolio and position in Rotterdam…

11th chainPORT annual meeting at Tanger Med Focuses on scaling AI in ports
Representatives from leading ports around the world gathered in Tangier, Morocco, on 29 and 30 October for the 11th chainPORT Annual Meeting, hosted…

Kalé research identifies that only five per cent of ports are fully digitised
Study launched at IAPH World Ports Conference identifies fragmented information sharing, paper-based processes, and skills shortages as persistent…
Subscribe to our newsletter!
if you dont want to swim alone in the ocean of news, sign up for the newsletter, and you will receive daily all the important news of world shipping!
