Indonesian Coal Flows Gradually Rebound


|
Following a weak start to 2025, Indonesian thermal coal shipments are showing signs of recovery. June marked the lowest monthly volume of the year at around 35 million tonnes, but by August exports had rebounded to nearly 48 million tonnes, surpassing year-ago levels. While first-half flows totaled 236.4 million tonnes, down from 263.0 million tonnes in 1H 2024, the strong August performance suggests some of the earlier contraction may be offset in the second half. Policy shifts are expected to support this turnaround. In late August, Indonesia removed the obligation for coal and mineral sales to use government benchmark prices as a floor, giving exporters greater flexibility to align with market indices. Taxes and royalties remain benchmark-linked, while September benchmark prices are expected to help Indonesian coal remain competitive against Australian and Russian cargoes. On the trade policy front, the EU–Indonesia Comprehensive Economic Partnership Agreement (CEPA) is due to be signed in Bali on September 23, a key step in strengthening Indonesia’s trade profile. At the same time, voyage data shows diversification beyond China and India, with the Philippines maintaining steady imports of Indonesian coal. In August, Panamax and Supramax shipments departed from Balikpapan, Taboneo, Tanjung Pemancingan, and Muara Berau, discharging at Sual, Limay, Pagbilao, Mariveles, and Davao. This underscores the Philippines’ role as a consistent outlet, even as its power mix gradually shifts toward LNG. For more information on this week’s freight, supply, and demand shipping trends, see the analysis sections below. You can also log in to our Newsroom page under Insights & News to stay updated with the latest reports.
SECTION 1/ Freight Rates ($/t) ‘The Big Picture’ – Capesize Firm
In the latter half of September, both the C3 and C5 routes are consistently maintaining stronger levels compared to the previous month, backed by robust support from miners’ activity. Current rates show little change from the prior week, holding at $24/ton for Brazil–China and nearly $11/ton for Australia–China. Meanwhile, the vessel count of Capesize ballasters to South Atlantic and West Australia continues to show a downward trend in their 7-day Moving Averages. This ongoing decrease, with South Atlantic nearing 250 and West Australia falling below 160, suggests a sustained firmness in the market.
Panamax – ECSA / Far East | USG / China Softer Panamax spot rates have softened on the East Coast South America (ECSA) and US Gulf (USG) to Far East routes. Specifically, ECSA to Far East prices are down 3% week-on-week, though still up 7% month-on-month. The USG-China route saw a 4% weekly decline but remains 7% firmer than a month ago. Panamax ballasters heading to ECSA have remained low since mid-August, with daily loaded volumes slightly under 0.8M tonnes. This trend is evident when examining both the vessel count and the ECSA’s daily loaded volume. SUPRAMAX -ECSA / Far East | USG / Far East Firmer Spot rates for Supramax vessels have continued to climb steadily. The East Coast South America (ECSA) to Far East route reached a peak of $37/tonne, marking a 10% increase from the previous month. Similarly, the US Gulf (USG) to Far East route also saw gains, rising 8% monthly to $47/tonne. While the daily loaded volume in ECSA has remained relatively steady at below 0.3M, the number of Supramax vessels ballasting to ECSA has reached a new peak of just under 130. This is an increase from the low of 113 observed at the end of August, and we are waiting to see how this may influence the freight market in the days ahead of September.
SECTION 2/ SUPPLY Capesize Ballasters Overview (# Vessel Count) Mixed
Panamax Ballasters Overview (# Vessel Count): Mixed
Supramax Ballasters Overview (# Vessel Count): Increasing Supramax ballasters view: Oversupply persists in the Pacific basin, evidenced by a 20% increase in ballasters in Australasia and a 39% increase in the Indian Ocean/South Africa region. The Atlantic also saw a significant rise, with a 39% increase in the South and a 10% increase in the North.
Handysize Ballasters Overview (# Vessel Count): Increasing
Handysize ballasters: Both the Pacific and Atlantic basins continued to show significant growth. The Far East/NOPAC region in the Pacific experienced a 7% increase, with Australasia seeing a 9% rise. In the Atlantic, the number of ballasters grew by 16% in the North and 7% in the South.
SECTION 3/ DEMAND Capesize Tonne Days | Coal Decreasing
Panamax coal shipments to the Far East have seen weaker tonne-day growth in the second quarter compared to the previous two years. While September began with more strength than July, it’s unlikely to reach 2023 levels due to lower Indonesian coal shipments to China in the first six months of the year. The coming weeks will shed more light on how recent Indonesian government actions regarding coal pricing and taxation will influence cargo volumes and tonne-day growth during the second half of the year. Atlantic America Decreasing
Port congestion in Atlantic America has decreased, with current levels down to 900, compared to over 1000 in 2023 and 2024. This trend points to lows last observed in the same period of 2022. Conversely, the Far East area, particularly Tianjin, is experiencing increased congestion. Additionally, the estimated port days trend for Atlantic America is approximately 11, significantly lower than the peak of 16 recorded in early September 2023. |


 https://go.signalocean.com/e/983831/-panamax-insights-downloadable/2rft3p/531251279/h/b2xe94iNTGkw1FmvY_R95dZKjyf_n0OHGvdOI9j2neE


 Panamax ballasters view: The number of ballasters continued to show a greater presence in the Pacific than in the Atlantic. Specifically, the Indian Ocean in the Pacific saw a significant 19% increase, while in the Atlantic, the South Atlantic exhibited a higher upward trend compared to the South.


Source: Signal Ocean



Related News.

European Shipowners call on MEPs to back Commission proposal to include two Indian yards in the EU ship recycling list
The Environment Committee of the European Parliament votes on 4 November on a motion for resolution objecting to the Commission’s proposal to add two…
Oversea signs commercial agreement with UECC following Successful Pilot
Following a successful pilot onboard Auto Advance, UECC has chosen to enter into a commercial agreement with Oversea. The pilot demonstrates how…

First NABEP Crude Cargo Under U.S. Agreement Arrives in Texas
Shipment of 1 million barrels arrived as NABEP production passes 223,000 barrels of oil equivalent per day. Two tankers carrying 1 million barrels of…
LNG carrier prices fall to $245 million, threatening Korean Shipbuilders’ Margins
Prices for high-value vessels, including liquefied natural gas carriers and ultra-large container ships, have begun to decline despite rising…
Vehicle Carrier Safety Forum publishes new Fire Drill Guidelines for vehicle carrying vessels
The Vehicle Carrier Safety Forum has published new Fire Drill Guidelines for Vehicle Carrying Vessels, providing vessel operators with a practical…

Is an Atlantic Basin crude glut on the cards?
Atlantic crude discounts fail to offset high freight to Asia, raising the risk of a regional glut as VLCC availability tightens. Freight…
The future of trade infrastructure in Europe is connectivity
One year after its inauguration, Rijeka Gateway offers a glimpse into the future of European trade. On 10 September last year,…

Allied – Weekly Market Review – Week 43
Please find below the Allied Weekly Report for Week 43 | 2026 ALLIED - Weekly Market Report- Week 43

Intermodal Report – Week 43 2026
Please find below the Intermodal market report for week 43 2026. Intermodal Report Week 43 2026
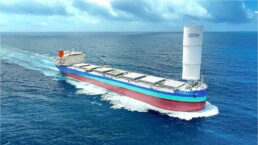
Wind Challenger-Equipped LNG Dual-Fueled Coal Carrier ‘MAIZURU KAZENOMAI’ Delivered
-While Supporting a Stable Energy Supply, Reducing Environmental Impact - Mitsui O.S.K. Lines announced the delivery and entry into service of an…
Subscribe to our newsletter!
if you dont want to swim alone in the ocean of news, sign up for the newsletter, and you will receive daily all the important news of world shipping!
