CHINA DATA: Independent refiners’ Iranian feedstock imports hit 8-month high in June


Iranian crude imports up 4.3% from May
Iranian crude accounts for 66% of feedstock portfolio
Utilization hit lowest since Shanghai lockdown
China’s independent refiners, mainly in eastern Shandong province, increased their Iranian crude imports by 4.3% in June to an eight-month high of around 6.1 million mt to cut feedstock costs and combat weak refining margins, according to sources and S&P Global Commodity Insights data July 4.
The volume was the highest since October 2023, when it hit 6.22 million mt, the data showed.
Iranian crude accounted for about 65.7% of the total feedstock portfolio of small-sized independent refineries in Shandong in June, compared with 54.2% in May.
June’s higher imports were mainly due to feedstock requirements of the independent refineries, which have been struggling with weak refining margins for most of 2024 so far, and are more selective with their feedstock, sources said.
Competitive price
Iranian crudes, which are much cheaper than Russian ESPO crudes, have gained more popularity among independent refineries in recent months.
“Other crudes are not [as cheap as] Iranian crudes,” said a trader source.
Early deals for August-arrival ESPO sold to China were heard at discounts of around 60-80 cents/b to ICE Brent, according to trade sources.
In comparison, Iranian Heavy was at a discount of around $9/b to ICE Brent on a DES Shandong basis, about $3/b lower than that of $5-$6/b for Iranian Light crude on the same basis, making it more attractive, especially under the weak margins, sources said.
More Iranian Heavy crude cargoes have been arriving in the Shandong market than Iranian Light crude, due mainly to the relatively lower prices, sources said.
Data from local energy information provider OilChem showed the monthly average margin at Shandong independent refineries, from processing imported crudes, fell 32.3% on the week to Yuan 83.5/mt July 4, amid high crude benchmarks coupled with lower oil product prices.
The average utilization rate also dropped marginally by 0.4 percentage point on the week to around 50.5% July 4, OilChem data showed.
This is their lowest utilization since May 2022, when China’s financial and industrial center Shanghai was locked down to control COVID-19.
Imports up 22% in H1 2024
In the first half of 2024, combined feedstock imports from Iran rose 22.3% on the year to 30.2 million mt from 24.7 million mt, Commodity Insights data showed.
These cargoes accounted for around 52.2% of feedstocks imported by independent refiners during the same period, growing from a low base of 35.8% in the corresponding period last year.
In comparison, imports from Russia fell 31.5% on the year to 20.78 million in H1 2024.
Iranian cargoes are usually masked as blended crudes that originate from Malaysia, such as Mal Blend as in the tables.
Iran output rising
The uptrend is likely to sustain amid Iran’s rising output.
Iran boosted its crude oil production by more than 70% over the past three years to 3.6 million b/d, following $34 billion investment in 155 projects, Oil Minister Javad Owji said June 24.
Owji was quoted by oil ministry news service Shana at the inauguration ceremony of a project in the onshore western oil field of Danan, which added 11,000 b/d to its output after 11 wells were drilled for $135 million, increasing its processing and production capacity to 19,000 b/d.
Independent refinery sources said the Iranian cargoes available in the market were mostly heavy crude, which were more economical, with slightly less light crude.
Commodity Insights collects information from trade and independent refinery sources, Kpler, shipping brokers, port sources and S&P Global Commodities at Sea, and the information has been confirmed by sources with knowledge about the matter.
Top feedstock suppliers for China’s independent refiners (‘000 mt):
| Jun-24 | May-24 | Change | Jun-23 | Change | |
| Malaysia | 7,118 | 7,176 | -0.8% | 6,986 | 1.9% |
| Saudi Arabia | 3,071 | 2,227 | 37.9% | 2,095 | 46.6% |
| Russia | 2,369 | 3,860 | -38.6% | 5,565 | -57.4% |
| Iraq | 1,342 | 699 | 92.0% | 780 | 72.1% |
| Kuwait | 425 | 269 | 58.0% | 280 | 51.8% |
| Brazil | 281 | 667 | -57.9% | 898 | -68.7% |
| UAE | 180 | 1,340 | -86.6% | 1,510 | -88.1% |
| Angola | 143 | 406 | -64.8% | 130 | 10.0% |
| Congo | 140 | – | – | – | – |
| Kazakhstan | 135 | – | – | – | – |
| Total* | 15,413 | 16,922 | -8.9% | 19,451 | -20.8% |
| H1 2024 | H1 2023 | Change | |
| Malaysia | 36,447 | 34,104 | 6.9% |
| Russia | 20,775 | 30,310 | -31.5% |
| Saudi Arabia | 17,204 | 10,936 | 57.3% |
| Iraq | 6,191 | 6,497 | -4.7% |
| UAE | 5,521 | 10,919 | -49.4% |
| Brazil | 2,987 | 3,066 | -2.6% |
| Kuwait | 1,589 | 1,810 | -12.2% |
| Angola | 1,078 | 667 | 61.6% |
| Qatar | 675 | – | – |
| Oman | 558 | 2,635 | -78.8% |
| Total* | 94,464 | 104,963 | -10.0% |
Top feedstock imports for China’s independent refiners (‘000 mt):
| Crude | Jun-24 | May-24 | Change | Jun-23 | Change |
| Mal Blend | 6,099 | 5,435 | 12.2% | 3,369 | 81.0% |
| Arab Light | 1,102 | 1,104 | -0.2% | 410 | 168.8% |
| ESPO | 1,082 | 2,294 | -52.8% | 2,897 | -62.7% |
| Arab Heavy | 978 | 285 | 243.2% | 1,135 | -13.8% |
| Basrah Medium | 778 | 135 | 476.3% | 230 | 238.3% |
| Arab Medium | 586 | 563 | 4.1% | 280 | 109.3% |
| Basrah Heavy | 564 | 564 | 0.0% | 550 | 2.5% |
| Khafji | 425 | 269 | 58.0% | 280 | 51.8% |
| Arab Extra Light | 405 | 275 | 47.3% | 270 | 50.0% |
| Urals | 200 | 185 | 8.1% | 1,230 | -83.7% |
| Subtotal* | 13,599 | 15,036 | -9.6% | 17,479 | -22.2% |
| Bitumen Blend | 875 | 779 | 12.3% | 651 | 34.4% |
| Fuel Oil | 939 | 1,107 | -15.2% | 1,322 | -28.9% |
| Total feedstock* | 15,413 | 16,922 | -8.9% | 19,451 | -20.8% |
| H1 2024 | H1 2023 | Change | |
| Mal Blend | 24,805 | 17,182 | 44.4% |
| ESPO | 11,453 | 16,676 | -31.3% |
| Arab Light | 7,378 | 2,750 | 168.3% |
| Arab Heavy | 5,254 | 6,246 | -15.9% |
| Basrah Medium | 3,812 | 2,584 | 47.5% |
| Sokol | 2,818 | 1,021 | 176.0% |
| Arab Extra Light | 2,661 | 820 | 224.5% |
| Basrah Heavy | 2,379 | 2,798 | -15.0% |
| Upper Zakum | 2,070 | 7,365 | -71.9% |
| Arab Medium | 1,911 | 1,400 | 36.5% |
| Subtotal* | 82,154 | 91,657 | -10.4% |
| Bitumen Blend | 4,163 | 6,347 | -34.4% |
| Fuel Oil | 8,147 | 6,959 | 17.1% |
| Total feedstock* | 94,464 | 104,963 | -10.0% |
*Includes imports from other countries, and other grades
Source: S&P Global Commodity Insights



Related News.

Global study finds Cyprus ranks SEVENTH and set for $1.1 billion AI GDP boost
Cyprus beats India and New Zealand to come SEVENTH in major AI study – with potential €1.1 billion GDP boost and youth jobs opportunity Some 86% of…

Global shipping’s trillion dollar climate bill according to Zero Carbon Analytics
A new study by Zero Carbon Analytics finds that emissions from international shipping cost the global economy around USD 963 billion between 1990…

Keeping Children Safe Online at Sea Seafy® earns friendly WiFi Certification across 26 vessels
Seafy becomes Friendly WiFi’s first partner in the maritime sector, helping protect kids from harmful content online. Friendly WiFi is delighted…

ShipManager joins Star Information Systems to accelerate the maritime industry’s transition to cloud
CFARER, a DNV Company selects Star Information Systems as the longterm home for ShipManager and its cloud future Star Information Systems (Star)…

Seafarer experience must shape maritime technology, initial STEER Project report finds
New research finds technology can shift rather than remove risk as The Nautical Institute, with support from Lloyd’s Register Foundation, calls for…

New LR service targets cargo disruption when trade routes fail
New LR Advisory service helps ports, governments and logistics operators respond to disruption, protect critical cargo flows and strengthen trade…

DORIC WEEKLY INSIGHT 06 NOVEMBER 2026
Please find below the DORIC Market Insight for the week ending 06th November 2026. Weekly Report 06.11.2026
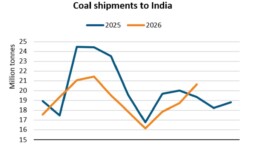
BIMCO Shipping Number of the Week
Coal shipments to India drop 7%, but limited recovery may lie ahead "Between January and October, coal shipments to India dropped 7% y/y due to the…

Hapag-Lloyd marks 20 years in South Africa and targets further growth
South Africa has become a cornerstone of Hapag-Lloyd's business in Africa Hapag-Lloyd surpasses 1 million TEU in Africa for the first time in its…
Subscribe to our newsletter!
if you dont want to swim alone in the ocean of news, sign up for the newsletter, and you will receive daily all the important news of world shipping!
